This site uses cookies to improve your experience. To help us insure we adhere to various privacy regulations, please select your country/region of residence. If you do not select a country, we will assume you are from the United States. Select your Cookie Settings or view our Privacy Policy and Terms of Use.
Cookie Settings
Cookies and similar technologies are used on this website for proper function of the website, for tracking performance analytics and for marketing purposes. We and some of our third-party providers may use cookie data for various purposes. Please review the cookie settings below and choose your preference.
Used for the proper function of the website
Used for monitoring website traffic and interactions
Cookie Settings
Cookies and similar technologies are used on this website for proper function of the website, for tracking performance analytics and for marketing purposes. We and some of our third-party providers may use cookie data for various purposes. Please review the cookie settings below and choose your preference.
Strictly Necessary: Used for the proper function of the website
Performance/Analytics: Used for monitoring website traffic and interactions
With the advancement of the contact center industry, benchmarks continue to shift and challenge businesses to meet higher customer expectations while maintaining efficiency. In 2025, achieving the right benchmarks means understanding the metrics that matter, tracking them effectively, and striving for continuous improvement.
Call abandonmentrate: Expresses the percentage of calls customers hang up on before speaking with an agent. Customer satisfaction (CSAT): Evaluates customer satisfaction through post-interaction surveys, asking them to rate their experience on a scale.
Start with common KPIs such as Average Handle Time (AHT), First Call Resolution (FCR) and abandonmentrates. We’re living in a grand time for call center technology, so embrace your options and don’t be afraid to adopt new tools. Create a benchmark for success. Gather customer feedback.
Your call center platform will give you plenty of quantitative data, such as abandonmentrates and service levels, which you can compare against your qualitative data, which includes customer feedback and surveys. Modern AI-driven tools are gaining popularity with contact centers. Invest in the Right Contact Center Software.
This data allows them to bolster those areas to meet or even surpass industry standard call center KPI benchmarks, which is essential for your brand’s reputation. Most large companies use them, but they are effective tools for small and medium-sized operations as well.
Call AbandonmentRate: This metric measures the percentage of callers who hang up before speaking with an agent. Why it matters: High abandonmentrates can indicate potential staffing issues or shortages, as well as long wait and resolution times that may indicate lagging agent performance.
One such tool, available on the VirtualPBX Premier Plan, is Live Dashboards , which provides call centers with a centralized hub to monitor queues, agent performance, and real-time call statistics. Managers can set benchmarks and intervene when call times exceed expectations.
And it’s work that most call center managers don’t have the time or tools to do. Fortunately, there are many easy (and free) ways to get back that “feel”. Easy Erlang tools: Experiment with an online Erlang C calculator like this one. Another option is the Excel macro you can download here.
Strategies to Improve Customer Satisfaction KPIs: Clearly define each metric and establish benchmarks. Five key KPIs help optimize efficiency: Average Handle Time (AHT) , Service Level , AbandonmentRate , Occupancy Rate , and Average Speed of Answer (ASA). Set realistic improvement targets and review progress regularly.
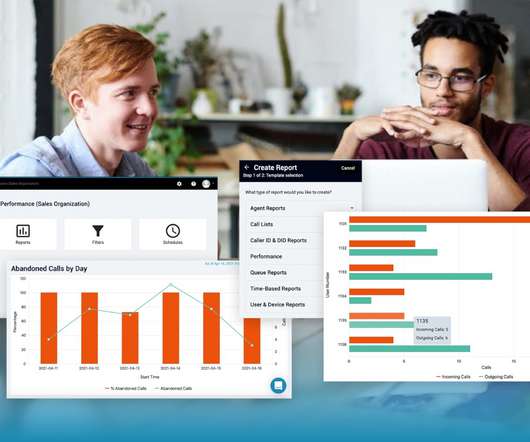
Today, we’re going to discuss five call metrics and KPI reports available for tracking within the VirtualPBX Advanced Call Reports tool that will improve your call operations and offer fine-grained control of your data. It’s a must-have report in every tool bag. Agent Summary. Service Level by Day. Get Advanced Call Reports.
If they found a low correlation between the two metrics, there is a business case for lowering SLAs … [but] If you were to do this … look at the impact service level has on your abandonrate, to ensure that you won’t lose too many calls. Here’s a great case study on a company that reduced abandonmentrate: First Service Credit Union.
Not only do they put strategies into action and contribute directly to customer satisfaction, but they provide valuable feedback and insights into the effectiveness and efficiency of contact center processes and tools. Leverage advanced forecasting and scheduling tools Meeting customer demand with optimal efficiency is both art and science.
Are agents equipped with the right knowledge and tools to support our customers? First-call resolution, average handle time, abandonmentrate, and customer satisfaction scores are all popular metrics that measure performance, and in turn, customer satisfaction. Are my operations meeting the company budget? Build a dream team.
Call center QA, or contact center QA, is a strategic, data-driven process that evaluates every facet and channel of customer interactionsfrom voice calls and live chats to emails and social media engagementsagainst established performance benchmarks. Transparency and clarity are paramount for agents to perform at their best.
Cart abandonment is one of the most frustrating things about an ecommerce business. No online store is immune, with studies showing an average cart abandonmentrate of 69.99%. But to be fair, some cart abandonments are simply a natural result of how users interact with online stores. Let’s face it.
These tools help managers identify patterns in call volume, spot inefficiencies, and make data-driven decisions that impact both customer satisfaction and operational costs. Analytics tools play a crucial role in enhancing center operations by leveraging data insights to streamline workflows and improve customer interactions.
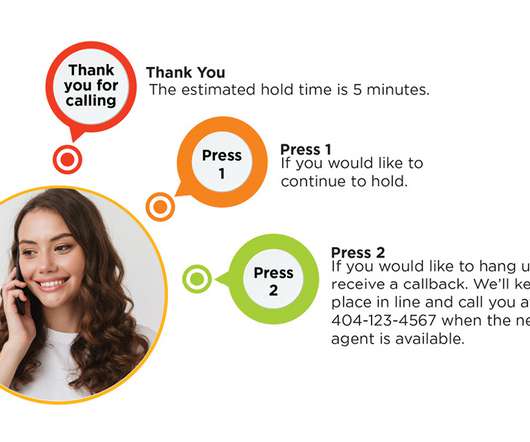
These complaints lead to high call abandonmentrates, poor customer experience, and worst of all, customer attrition. This feature alone allowed a radiology clinic to cut their abandonmentrate in half. We’ve seen a massive reduction in abandons just by providing an estimated hold time.
According to CSG , the global average rate for absenteeism is 5%. This is a good benchmark to work with if you’re measuring this metric for the first time. If your absence rate exceeds the global average, you should address this metric immediately. Here are the key metrics directly affected by absence rate: Cost of operation.
Improve workforce management with real-time support tools to ensure efficient task handling. Average Call AbandonmentRate (ACAR) If calls answered are low and calls blocked or abandoned are high, customer behavior signals frustration. Adjust staffing through predictive workforce management tools to match demand.
Improve workforce management with real-time support tools to ensure efficient task handling. Average Call AbandonmentRate (ACAR) If calls answered are low and calls blocked or abandoned are high, customer behavior signals frustration. Adjust staffing through predictive workforce management tools to match demand.
Average Speed of Answer is one measurement that highlights the areas that need improving in your customer journey, making it a valuable tool for both managers and agents. Many call center analytics tools automatically calculate ASA for you, making it easier to track this metric. What Is Average Speed of Answer?
That also means choosing the right live chat solution that offers a variety of advanced features and customizations to give agents the best tools for the job. With these tools in place, Comm100’s live chat benchmarks have shown an impressive 84% positive rating across all organizations. Calculate now. ROI Calculator.
It helps leaders prioritize their people and team communication over rigid processes and tools. Reduce call abandonmentrate by 5% by the end of the month. Set benchmarks and measure your team on how they perform against them. Reward and recognize those who achieve or surpass your benchmarks and coach up those who don’t.
They can be a valuable training tool when used correctly. Or, you might share a few metrics like FCR or abandonrate before and after your team uses Fonolo’s Voice Call-Backs! Have a seasoned employee demonstrate how to use a tool or complete a task. Demonstrations make it much easier to learn new tools and equipment.
Average AbandonmentRate The percentage of customers who hang up before reaching an agent. The new Talkdesk BenchmarkTool shows how your Average AbandonmentRate stacks against metric-candy hunting peers. Let’s carve together the big pumpkin that is your contact center metrics.
Average Call AbandonmentRate. The average call abandonmentrate (ACAR) indicates the number of customers that abandon calls if they wait on hold for too long. If they have to transfer several times, however, they’re more likely to abandon the line. Call Transfer Rate. Agent Turnover Rate.
You can still use extrinsic motivators in the call center, but they shouldn’t be your primary tool for leading your team. TIP: While call center metrics like AHT and FCR are great benchmarks for performance, they aren’t great motivators. Give them the right tools and technology. Intrinsic Motivators. Encourage agent autonomy.
One of the primary tools for customer engagement is the telephone. The article cites three common performance benchmarks that can help you compare how your call center measures up against other call centers. They include: 13% is the average call abandonmentrate.
Average Call AbandonmentRate If customers are waiting on hold too long, they are likely to abandon calls. Abandoning a call can cause immense frustration for customers and make them lose faith in your company. Abandoning a call can cause immense frustration for customers and make them lose faith in your company.
In a recent article for CXM Today, we gave our complete guide to call center tools and metrics to drive CX growth. AbandonmentRate: Rate at which customers disconnect before reaching an agent. We encourage you to check it out. KPI tunnel vision is holding your CX initiatives back. Have Questions About CX Strategy?
From sales and lead generation, to engagement and loyalty, live chat is an incredibly flexible tool. Dawson College understood that developing a personal connection with the students was essential, so they also incorporated Comm100’s video chat tool so they could speak face-to-face. It’s definitely not an exhaustive list!).
Cost-effective communication tools can enable remote collaboration without substantial overhead costs. Furthermore, consider leveraging internet-based communication tools like video conferencing and collaboration platforms for international communications.
BPO providers invest heavily in training their staff and implementing the latest technologies (including AI and automation tools). This includes advanced call routing systems, customer relationship management (CRM) software, and analytics tools. Use industry benchmarks to guide your goal-setting process.
While both tools are pivotal, understanding their unique roles and synergies is crucial for any business aiming to optimize and improve its customer service landscape. Its intuitive interface and straightforward analytics tools offer quick insights into call volumes, agent performance, and customer satisfaction metrics.
Call centers will also utilize call center tools that assist with the distribution of inbound calls. Our consumer benchmark study revealed that 87% of consumers are willing to buy more products from businesses that provide great experiences, so it’s a sound strategy. This may help them with benchmarking and goal setting.
Before we begin, let’s clarify some of the other metrics that didn’t make it in the top 5 but are considered relevant, like Average Speed of Answer and Call AbandonmentRate. Benchmark performance vs. industry peers. This outcome is counter-intuitive but this is what happens. Call center KPIs to measure for success.
We’ve compiled the call centre metrics you should be tracking right now, from abandonmentrate and cost per call to FAQs. Abandonmentrate. Average abandonmentrate is a strong indicator of how satisfied your customers are with your call centre. What are the call centre metrics that need to be tracked?
If you have an existing call center, you should analyze call center performance and efficiency metrics to understand your benchmarks before bringing on a new team. Workforce management (WFM) tools and strategies are essential to accurately forecasting call volume and estimate scheduling and staffing needs.
Average call abandonmentrate The average call abandonmentrate metric looks at how many customers drop the call before reaching an agent. To calculate for average call abandonmentrate: [(Total number of calls – Number of calls that reached agent) / Total number of calls] x 100 7.
First Contact Resolution : This metric denotes the rate at which your agents are able to solve customer issues satisfactorily during the first call. Average AbandonmentRate : If your customers hang up the call before reaching an agent, the interaction is counted within the abandonmentrate. Conclusion.
AbandonmentRates A recent survey reported average abandonmentrates between five percent and eight percent, with the benchmark for healthcare being at nearly seven percent. First Contact Resolution Rate The healthcare industry benchmark for first contact resolution ( FCR ) rate in healthcare is 71 percent.
A good call center optimization model will enhance customer service in the following ways; To simplify the agent’s job: When the workers or agents are given appropriate tools, they are more likely to manage the calls nicely without jumping from screen to screen and platform to platform. Which Tool Should I Use for Call Center Optimization?
This unexpected termination of the conversation is what’s termed as a ‘dropped call’ According to HubSpot , the acceptable rate of dropped calls for a call center varies by industry, but on average, most call centers should have a call abandonmentrate between 5% and 8%. Moreover, OMNI+ guarantees 99.9%
A call center dashboard is a centralized tool designed to monitor and analyze various aspects of call center operations. Historical dashboards serve as invaluable tools for benchmarking performance over time and driving continuous enhancement of service quality. Table of Contents What is a Call Center Dashboard?
We organize all of the trending information in your field so you don't have to. Join 34,000+ users and stay up to date on the latest articles your peers are reading.
You know about us, now we want to get to know you!
Let's personalize your content
Let's get even more personalized
We recognize your account from another site in our network, please click 'Send Email' below to continue with verifying your account and setting a password.


Let's personalize your content