This site uses cookies to improve your experience. To help us insure we adhere to various privacy regulations, please select your country/region of residence. If you do not select a country, we will assume you are from the United States. Select your Cookie Settings or view our Privacy Policy and Terms of Use.
Cookie Settings
Cookies and similar technologies are used on this website for proper function of the website, for tracking performance analytics and for marketing purposes. We and some of our third-party providers may use cookie data for various purposes. Please review the cookie settings below and choose your preference.
Used for the proper function of the website
Used for monitoring website traffic and interactions
Cookie Settings
Cookies and similar technologies are used on this website for proper function of the website, for tracking performance analytics and for marketing purposes. We and some of our third-party providers may use cookie data for various purposes. Please review the cookie settings below and choose your preference.
Strictly Necessary: Used for the proper function of the website
Performance/Analytics: Used for monitoring website traffic and interactions
Customizable Solutions TeleDirect offers flexible plans tailored to your specific business needs, allowing you to scale services as your business grows. Real-Time Reporting and Analytics Access insights into call volume, Average Handle Time (AHT),Call AbandonmentRate, and servicelevel metrics to continuously optimize performance.
In the world of contact center metrics, servicelevel has always held a special place. This metric is universally understood across the industry, and clearly conveys how quickly customer calls are answered by support agents. What is the Purpose of ServiceLevels? Where Did the 80/20 ServiceLevel Rule Come From?
24/7 Call Center Solutions: Enhancing CustomerExperience Around the Clock 24/7 Call Center Solutions are essential for businesses aiming to provide seamless customer support, enhance customer satisfaction, and stay competitive in todays fast-paced marketplace. Increased customer retention and brand loyalty.
In the wide world of call center metrics, “servicelevel” has always held a special place. The longevity of servicelevel is astonishing when one considers the enormous changes that have occurred in customerservice technology over the last few decades. Surprisingly, servicelevel is in 4 th place!
To find how contact centers are navigating the transition to omnichannel customerservice, Calabrio surveyed more than 1,000 marketing and customerexperience leaders in the U.S. about their digital customer communication strategies. Read the report to find out what was uncovered.
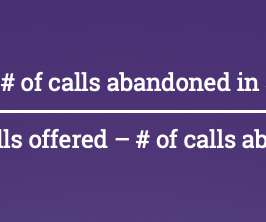
Definition of AbandonRate: The percentage of calls ended by the caller before being answered by an agent. Calculation: Abandoned Calls/ (Abandoned Calls + Answered Calls) X 100. Example: 90 calls are answered; 10 calls are abandon before they’re answered. Abandonrate is 10/ (10+90) which is 10%.
Top 10 Metrics to Measure Call Center Success Measuring the success of a call center is essential for understanding its performance, identifying areas for improvement, and delivering exceptional customerexperiences. Call AbandonmentRate Definition: The percentage of calls disconnected by customers before reaching an agent.
Abandonmentrate. Abandonmentrate measures the number of callers that hang up before an agent picks up the phone. Long wait time is the most common reason for call abandonment. Call center managers might consider investing in visual IVR and hiring more agents to lower abandonmentrates.
This industry truly grasps what customerexperience is all about, and we’re always happy to help them provide a great service to their communities. billion full-service financial institution, owned and operated by over 50,000 members of the Stanford Community. 50% reduction in abandonrate.
A Guide to Call AbandonmentRate in Call Centers and Its Significance Are you dealing with high call abandonmentrates? Providing exceptional customerservice is crucial in today’s call center environment, but what if your customers disconnect even before reaching an agent?
Overview Servicelevel is one of the most important metrics for a contact center to measure and manage and has been in place since contact centers evolved. Organizations are missing opportunities to view this metric differently to manage customerservice delivery and its associated costs more effectively. Is that okay?”
Just for starters, the abandonrate fell from 20 to 2.5 Servicelevels improved significantly, even as contact center volume exploded! The post BAYADA Home Health Care Reduces Call AbandonRate 87% appeared first on NICE inContact Blog. percent—an 87 percent reduction!
Businesses that harness this information effectively can boost customer satisfaction by up to 25% while reducing churn. The key is turning raw interactions into actionable call center insights that enhances both efficiency and customerexperience. Abandonmentrate reveals customer patience thresholds.
Determining inbound servicelevel goals is one of the most important factors for anyone responsible for the inbound call center function. Determining the right inbound servicelevel goal is not straight forward. Inbound ServiceLevel Goals: Factor Number 1. Know your customer or prospect.
As the primary drivers of cost-cutting initiatives in the contact center, customer support/service leaders must continue to focus on costs while maintaining a clear vision (or establishing this clear vision if one doesn’t yet exist) to support WFH. Abandonmentrate. Servicelevel.
Their functionalities extend to dynamic knowledge creation and application, making them instrumental intelligence tools for delivering a consistent customerexperience across all touchpoints. A robust knowledge management strategy can alleviate these challenges and help your company deliver a better customerexperience.
When it comes to metrics for tracking call center performance, servicelevel is the undeniable king of the hill. Cool Scatter Plot of ServiceLevels! One chart really jumps out: A scatter plot of all the servicelevels that call centers are using. The Case against ServiceLevel as “North Star”.
AbandonmentRate. If your abandonrate is high, it represents lost business — and what’s worse, it means that you’ve failed to serve someone in need. The average abandonrate for the medical and healthcare industries is 13% – TalkDesk. How to Overcome Challenges with Your Call Center Metrics.
Deep knowledge of your customer’s journey and careful implementation of your call center tools and solutions are still the keys to improving problems like abandonmentrates. So, how do you reduce abandonmentrates in today’s contact center? What Do High Call AbandonRates Really Mean? Are we sure?
Among these, the best inbound call centers stand out for their ability to handle incoming customer inquiries with professionalism and efficiency, ensuring an exceptional customerexperience. Advanced Technology Modern call centers leverage state-of-the-art technology to enhance efficiency and customerexperience.
Agent performance is at the core of overall contact center productivity as well as customerexperience quality. Driving Business Growth and Success: Exceptional customerexperiences translate to increased customer retention, positive word-of-mouth referrals, and ultimately, significant business growth.
If this scenario sounds familiar, and you lack the in-house resources to service every customer call in a timely fashion, you may consider hiring a third-party call overflow handling service. 3 Proven Ways to Reduce AbandonRates in the Call Center. Why use a call overflow handling service? Location: USA.
In this one-hour webinar, you’ll learn how call-backs are not only the number one way to manage call center spikes , but can also: Improve the CustomerExperience; Lower Telco Costs; Reduce Lower Handle Times; and. Lower AbandonmentRates. Improving Customer Satisfaction. Lowering AbandonRates.
Your Step-By-Step Guide to Building Better CustomerExperience Strategies Use data you already have to build actionable strategies for a better customerexperience Get the eBook. Call center KPIs give insight into your agents’ interactions with customers. Servicelevel. Call abandonmentrate.
If most call center teams had to pick a “North Star” it would be servicelevel, which measures the length of time callers wait to reach an agent. It’s kind of surprising that, despite all the enormous changes that have occurred in customerservice technology, the dominant metric remains servicelevel.
While the list of KPIs is endless, standard metrics that have stood the test of time include Quality Assurance (QA), Customer Satisfaction (CSAT), First Call Resolution (FCR), After Call Work (ACW), ServiceLevel, and Occupancy. This hurried approach frequently left customers feeling dissatisfied. Even AHT remains useful.
Here are some examples of how raw data can inform reporting: Hold time is an analytic that informs reporting on abandonmentrates and servicelevel. Number of calls is an analytic that informs reporting on agent occupancy rate. Abandonmentrate. How to Calculate Occupancy Rate in a Call Center.
Improve the Customer Journey. When it comes to customerexperience, you first need to understand the customer journey with your call center. We hear a lot about reducing friction for customers in this industry. Below we’ll discuss some areas you can address when developing your call center improvement strategy.
Eliminates hold times, lowering call abandonmentrates. Customers left waiting on hold are more likely to end the call before getting through to an agent. This results in lowered abandonmentrates – plus, it reduces overwhelm for your agents. Better customerexperience (CX).
When it comes to outsourcing your customerservice to a call center, there are a range of metrics that call centers use to ensure they are delivering a superior customerexperience (CX) for your customers.
Servicelevel, response time and abandonmentrate. First, a reminder of what each of these metrics is: Servicelevel: the percentage of calls answered within a predetermined number of seconds. Response time: the average time it takes to respond to a customer call. Here’s how.
Contact center key performance indicators (KPIs) are critical for measuring and improving customerservice operations. At Outsource Consultants, we understand the pivotal role these metrics play in driving success and enhancing customerexperiences. Offer callback options to reduce customer wait times.
In this one-hour webinar , you’ll learn how call-backs are not only the number one way to manage call center spikes , but can also: Improve the CustomerExperience; Lower Telco Costs; Reduce Lower Handle Times; and. Lower AbandonmentRates. Improving Customer Satisfaction. Lowering AbandonRates.
Setting up a call overflow service is ultimately the more time and cost-efficient choice. When utilized strategically, it can also have a positive impact on your CSat scores and overall customerexperience offerings. Read on for the top four reasons your call center should be using a call overflow handling service.
AbandonmentRate. ServiceLevel. We’ve chosen 5 popular call center benchmarks: ServiceLevel, Average Speed to Answer, AbandonmentRate, Call Duration (also known as Average Handle Time), and First Call Resolution, to help you determine whether or not your contact center is performing optimally.
Really, it’s a promise, one you must keep in order to satisfy clients and maintain the servicelevels that will keep your long-lasting relationship with them buoyed. Anyone working in the service industry, be it in retail, health or finance, should get the low-down on ServiceLevel Agreements (SLAs), and fast.
The first thing that grabbed ClickPay’s attention was how easily and intuitively the Talkdesk solution integrated with Zendesk , allowing ClickPay’s agents to quickly access customer information and focus more time and effort on the customer. Talkdesk is listening, evolving and consistently making their software better for customers.”.
For many years, contact centers have used the Erlang staffing calculator to forecast how many agents they require to meet agreed servicelevels. Erlang C is predominantly used for queuing calculations based on call volumes and the number of agents necessary to achieve certain servicelevels. Accurate forecasts.
Many organizations now report that outsourcing decisions are no longer solely based on cost reduction, but to utilize value-added services that improve the customerexperience. As the demand for outsourced call centers grows annually by 6%, it’s critical for BPOs to offer services that meet these growing expectations.
With these realities in mind, let’s take a look at three proven ways to baby-proof your own contact center by providing exceptional customerexperience and keeping the bottom line in mind. And: Call-back technology is dynamic and adaptable (the key is offering them to customers on their preferred channel(s)). Plus, so much more!
Offering your customers the option of queuing virtually dramatically reduces the abandonmentrate. A virtual queuing option improves customer satisfaction. Virtual queuing is a great way to reduce your Average Speed of Answer and maintain your agreed servicelevel. first appeared on Fonolo.
Without proper management, call center agents could be left to handle overwhelming days on their own, lack incentive or structure to grow within their role, and become bored and burnt out fast, leading to high turnover and poor customerexperiences. Servicelevel – the percentage of calls answered within a specified time frame.
And, while that doesn’t necessarily shed any new light onto our customerexperience outlooks, isn’t it what all of our strategies are trying to do? When you treat your customers like a valuable piece of your corporate puzzle they’re going to be more loyal. Access to customer information? ServiceLevel.
As part of your servicelevel, you need to know how long customers are in the queue. The industry standard for servicelevel is 80/30, where 80% of the calls are answered in 30 seconds or less. AbandonmentRate. Those leftovers get abandoned. Those leftovers get abandoned.
We organize all of the trending information in your field so you don't have to. Join 34,000+ users and stay up to date on the latest articles your peers are reading.
You know about us, now we want to get to know you!
Let's personalize your content
Let's get even more personalized
We recognize your account from another site in our network, please click 'Send Email' below to continue with verifying your account and setting a password.


Let's personalize your content