This site uses cookies to improve your experience. To help us insure we adhere to various privacy regulations, please select your country/region of residence. If you do not select a country, we will assume you are from the United States. Select your Cookie Settings or view our Privacy Policy and Terms of Use.
Cookie Settings
Cookies and similar technologies are used on this website for proper function of the website, for tracking performance analytics and for marketing purposes. We and some of our third-party providers may use cookie data for various purposes. Please review the cookie settings below and choose your preference.
Used for the proper function of the website
Used for monitoring website traffic and interactions
Cookie Settings
Cookies and similar technologies are used on this website for proper function of the website, for tracking performance analytics and for marketing purposes. We and some of our third-party providers may use cookie data for various purposes. Please review the cookie settings below and choose your preference.
Strictly Necessary: Used for the proper function of the website
Performance/Analytics: Used for monitoring website traffic and interactions
Leverage AI-Powered Chatbots and Self-Service Options AI-driven chatbots can resolve common customer inquiries instantly. Implement self-service portals for tasks like billing inquiries, order tracking, or password resets. Gather and Implement Customer Feedback Send post-call surveys to identify areas for improvement.
Collected through post-call surveys, CSAT scores provide direct customer feedback. Net Promoter Score (NPS) : Measures how likely customers are to recommend your services to others. Call AbandonmentRate : Tracks the percentage of calls disconnected before being answered. A strong NPS indicates a loyal customer base.
Types of analytics: Performance metrics are measured using different approaches, including descriptive, predictive, prescriptive, interaction, speech and text, self-service, and cross-channel analytics. Average handle time (AHT): Tracks how long an agent takes to complete a customer service interaction.
Offer self-service options for quick solutions to common issues. Empower Call Center Agents with Proper Training A knowledgeable and confident customer service team plays a crucial role in providing superior CX. Call abandonmentrates. Optimize workforce management to match staffing levels with call volume.
To find how contact centers are navigating the transition to omnichannel customer service, Calabrio surveyed more than 1,000 marketing and customer experience leaders in the U.S. about their digital customer communication strategies. Read the report to find out what was uncovered.
This metric helps you identify if your customers are satisfied with your services and the products you sell or if your brand meets their expectations. To calculate this metric, you need to roll out a customer satisfaction survey that can be sent out to customers once they’ve made a purchase or had a recent interaction with your support team.
After-call surveys are a great way to achieve this. Your call center platform will give you plenty of quantitative data, such as abandonmentrates and service levels, which you can compare against your qualitative data, which includes customer feedback and surveys. Provide Self-Service Options.
That’s where self-service comes in. Customer self-service, or CSS, refers to any type of electronic or automated support that allows customers to find answers or resolve problems without having to connect with a customer service agent. Movements from the human realm to the self-serve realm is harder.
Additionally, in the recent 2023 State of CX report conducted by The Northridge Group , survey responses revealed that while nearly 50% of consumers had knowingly spoken to a customer service associate working from home, almost 75% of those respondents felt the associate’s location did not impact the resolution of their issue.
Image courtesy of Unsplash Does self-service reduce or increase effort? I wrote about technology and the customer experience a couple times last year; after all, that''s what self-service is all about: technology. ATMs, online flight check-in, self-checkout grocery lanes, IVRs, online FAQs and knowledgebases, and more.
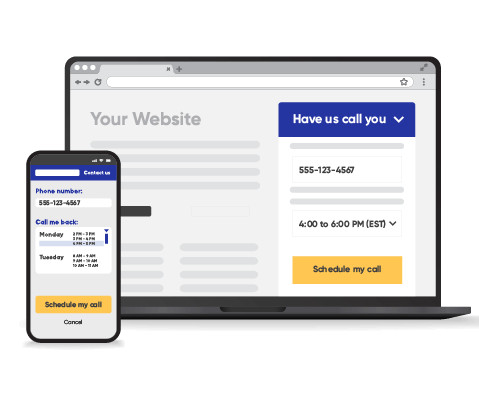
Use metric-tracking software to determine if your average handle time is increasing, first call resolution is falling, abandoned call rates are rising, or customer satisfaction survey results are going down. Empower your customers with self-service options. Have you heard of Visual IVR ?
Start with common KPIs such as Average Handle Time (AHT), First Call Resolution (FCR) and abandonmentrates. Most contact centers gather customer information through surveys, questionnaires, and call center recordings. Can you offer self-service channels on your website? Gather customer feedback.
Also, with the improvement in self-service, call volume typically consists of a more complex series of calls, which AHT can measure less predictively. One way to gauge customer satisfaction is using surveys that contain OSAT related questions, such as “What was your overall satisfaction with the experience?”
Have them review your self-service pages and any others in your journey — such as landing pages and shopping pages. Send out surveys to customers and get their feedback on your sales process. You can also cut your abandonmentrate by more than half and even make a healthy ROI. Get a copywriter. Empower your agents.
To lower costs and ease burden off your agents, Visual IVRs can utilize chat bots and intuitive AI technology to answer commonly asked customer questions and drive them to self-service channels, such as an online knowledge base or FAQ. FACT: 44% of people surveyed in the U.S. That’s 21% higher than any other channel available.
Connecting with Customers from Start to Finish Learn why meeting the demands of today’s customer self-service journey requires next-generation knowledge management. CSAT surveys help measure customer contentedness before, during, and after those interactions. . Download the free ebook. What is NPS and how is it calculated?
According to a recent Zendesk survey , around 42% of customers say their definition of bad support is when they get stuck in an automated system that makes it hard to reach an agent. DID YOU KNOW? For some companies, this means a multi-level IVR with many steps before accurately routing to the correct agent or department.
That’s because nearly 40% of current incoming call volume can be handled entirely with automated, self-service channels , according to a business leader survey from Gartner. Emphasizing self-service via call deflection allows you to automate customer engagements across sales, support, product info, etc. —
Visual IVR – now known as Fonolo’s Web Call-Backs – was one of the first self-service technologies to have a hugely positive impact on the customer experience. Their survey revealed that a bad IVR experience makes situations worse and turns neutral customers into dissatisfied ones. According to a report by J.D.
Voice self-service has been an integral part of contact center initiatives for years. Although the reason for using self-service options varies from use case to use case, the majority of us — customers, employees, and enterprise leaders alike — agree it's a convenient service channel.
And although an 80/20 service level is still the most common for contact centers, that doesn’t tell the whole story. A recent report by Natterbox, NICE InContact, Jabra, and Serenova that surveyed 250 contact centers found that there are, in fact, a wide range of service levels in use today, ranging from 50/40 to 100/180.
A new survey from Call Centre Helper confirms that the reign of 80/20 continues, but there is more to the story. The report surveyed over 250 contact centers, asking questions about how companies are delivering customer service over voice, email, chat, and social media. The Case against Service Level as “North Star”.
Service level came in fourth place, behind customer satisfaction, FCR, and advisor satisfaction! A report by Natterbox, NICE InContact, Jabra, and Serenova that surveyed 250 contact centers found that there are, in fact, a wide range of service levels in use today, ranging from 50/40 to 100/180.
First call resolution rate: The percentage of calls that are resolved on the first call. Abandonmentrate: The percentage of calls that are abandoned by customers before speaking to an agent. Just as the name suggests, CSat rates show how satisfied customers are with their call center experience.
Screen calls, schedule callbacks, initiate simple call surveys, and more to simplify basic interactions so that you can maximize your human capital in favor of customer interaction. Customize your dashboard with metrics like hold times, first call resolutions, and abandonrates for a constant pulse on experience.
Additional metrics to consider include: NPS scores First response time (FRT) Abandonrates Hold times Average Handle Time (AHT) 4. Combine interaction data with CRM insights, customer surveys, and operational metrics to create a truly 360-degree view of the customer journey.
Replacing hold-time with a call-back is a no-brainer: It eliminates something that customers universally dislike, while lowering abandonrates. 2) In the age of self-service, remember many still need to talk to you; don’t make it impossible to find your phone number. And then there is self-service.
Five key KPIs help optimize efficiency: Average Handle Time (AHT) , Service Level , AbandonmentRate , Occupancy Rate , and Average Speed of Answer (ASA). Strategies to Lower AbandonmentRates: Provide estimated wait times to set customer expectations. Offer self-service options for quick issue resolution.
FACT: According to Zippia, only 48% of employees surveyed believe their company’s leadership abilities are “high-quality”. Determine what your employees think of your leadership skills with an anonymous survey. Call volume Call abandonmentrate. Average handling time (AHT). First call resolution. Net promoter score (NPS).
It is based on an extensive survey of customer experience, contact center, operations, information technology, marketing and business development professionals. Respondents to the survey ranked the top six objectives in the following order, with the most important first. 18% say they outsource some operations.
Minimizes complaints and abandonmentrate. A recent survey conducted by Tata indicates that nearly 32% of major companies currently use AI in customer care. 24/7 SelfService. Self-service options enable customers to solve issues on their own. AI Assisted Services. Provides proactive alerts.
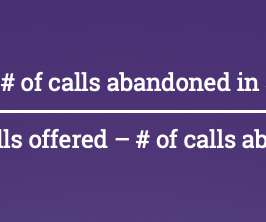
Self-service metrics. Call abandonmentrate. Call abandonmentrate. What is call abandonmentrate? Why should you measure call abandonmentrate? It’s a survey question “How easy was it for you to get your problem solved?” Navigate this guide: Productivity metrics.
Measure CSAT through surveys sent after an email interaction, or as a quarterly email blast. These survey responses then give you a sense of how happy your customers are. How to Measure it: Number of satisfied customers (4 and 5) / Number of survey responses) x 100 = % of satisfied customers. AbandonRate.
Intelligent routing that is optimized for your customer journey can lower abandonrates, reduce queue times for calls, and provide tailored call-back options for times of particularly high call volume. IVR technology gives organizations options for their callers to self-serve and leave messages. Measuring Customer Satisfaction.
Keep in mind that only a small percentage of customers complete surveys (higher percentage if calling). So you need to initiate enough surveys to get a reasonable sample size. Also, regardless of the level of accuracy, the measurement identifies the movement (improvement or deterioration) correctly. Look at improving the processes.
Realize substantial savings through deflecting calls to self-service channels such as a knowledge base. In addition to improved call routing, you’ll enable speedier self-service options, which can improve your customer satisfaction score by 10% or more. Handle peak-hour traffic more efficiently.
Abandonmentrate reveals customer patience thresholds. Rates exceeding 5% signal serious problems with queue management or staffing levels. Implementing call-back options can dramatically reduce abandonment while maintaining service levels. When volume spikes unexpectedly, resources can be reallocated instantly.
And remember to keep costs of shipment low, if possible, as it’s one of the reasons why customers abandon shopping carts. In fact, the typical shopping cart abandonmentrate for online retailers varies between 60% and 80% , what means that, on average, 7 out of every 10 customers will abandon shopping cart! #5:
Service levels clearly have relevance for ‘real-time’ exchanges like phone calls or chat sessions. In all cases we see very different standards, self-service options that can make the initial contact, and changing consumer expectations. AbandonRate also works well for chat sessions.
Service levels clearly have relevance for ‘real-time’ exchanges like phone calls or chat sessions. In all cases we see very different standards, self-service options that can make the initial contact, and changing consumer expectations. AbandonRate also works well for chat sessions.
Every year, many analyst firms and research groups try to illuminate the future with surveys. And one of the most common ways to present results from those surveys is via the cohort chart. Here’s another example: That one was our “highlight chart” when we covered Five9 ’s Customer Service Index Report. Beware the Cohort Study.
This reduces hold times, call abandonmentrates, and staffing needs. That’s because you have to spend more in between recruiting, onboarding, and higher turnover rates. Eliminate Unnecessary Calls Improve self-service options on your website so customers can find answers without calling in.
However, you can also reduce average time in queue by improving the number and quality of self-service options. Average AbandonmentRate The Average AbandonmentRate refers to the number of callers who hung up or otherwise were dropped from the queue before their call was answered.
This can be done in a variety of ways, including with Customer Satisfaction Surveys that are sent out after a call or chat. Self-Service Usage : Often times, customers can resolve their own issues without needing to get in touch with an agent. Call SLA : A goal based on what % of the calls are answered in X seconds.
We organize all of the trending information in your field so you don't have to. Join 34,000+ users and stay up to date on the latest articles your peers are reading.
You know about us, now we want to get to know you!
Let's personalize your content
Let's get even more personalized
We recognize your account from another site in our network, please click 'Send Email' below to continue with verifying your account and setting a password.


Let's personalize your content