This site uses cookies to improve your experience. To help us insure we adhere to various privacy regulations, please select your country/region of residence. If you do not select a country, we will assume you are from the United States. Select your Cookie Settings or view our Privacy Policy and Terms of Use.
Cookie Settings
Cookies and similar technologies are used on this website for proper function of the website, for tracking performance analytics and for marketing purposes. We and some of our third-party providers may use cookie data for various purposes. Please review the cookie settings below and choose your preference.
Used for the proper function of the website
Used for monitoring website traffic and interactions
Cookie Settings
Cookies and similar technologies are used on this website for proper function of the website, for tracking performance analytics and for marketing purposes. We and some of our third-party providers may use cookie data for various purposes. Please review the cookie settings below and choose your preference.
Strictly Necessary: Used for the proper function of the website
Performance/Analytics: Used for monitoring website traffic and interactions
In the world of contact center metrics, servicelevel has always held a special place. What is the Purpose of ServiceLevels? Call center servicelevels are, broadly speaking, a commitment to a particular average speed of answer, or ASA. Where Did the 80/20 ServiceLevel Rule Come From?
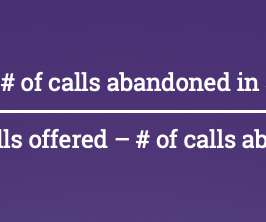
How to Measure: CSAT = (Number of Satisfied Customers / Total Survey Responses) 100 4. Call AbandonmentRate Definition: The percentage of calls disconnected by customers before reaching an agent. How to Measure: Call AbandonmentRate = (Abandoned Calls / Total Incoming Calls) 100 6.
When it comes to metrics for tracking call center performance, servicelevel is the undeniable king of the hill. A new survey from Call Centre Helper confirms that the reign of 80/20 continues, but there is more to the story. Cool Scatter Plot of ServiceLevels! The Case against ServiceLevel as “North Star”.
In fact, according to the 2019 Deloitte Global Contact Center Survey, 53% of companies surveyed expect their total contact center volume to increase over the next two years. High abandonmentrates lead to unhappy patients and, ultimately, a delay in care. Technology is causing an increase in contact center communications.
To find how contact centers are navigating the transition to omnichannel customer service, Calabrio surveyed more than 1,000 marketing and customer experience leaders in the U.S. about their digital customer communication strategies. Read the report to find out what was uncovered.
While the list of KPIs is endless, standard metrics that have stood the test of time include Quality Assurance (QA), Customer Satisfaction (CSAT), First Call Resolution (FCR), After Call Work (ACW), ServiceLevel, and Occupancy. ServiceLevel is another metric to watch. Satisfaction surveys are one solution.
AbandonmentRate. If your abandonrate is high, it represents lost business — and what’s worse, it means that you’ve failed to serve someone in need. The average abandonrate for the medical and healthcare industries is 13% – TalkDesk. How to Overcome Challenges with Your Call Center Metrics.
Servicelevel. Servicelevel is a fundamental metric. Your servicelevel tells you how accessible your contact center is to your customers.It’s a metric that helps you evaluate customer demand and staff appropriately for their needs, and it’s a great place to start when you look at KPIs.
Why are you measuring servicelevels that way? One way that consumer satisfaction finds its way into operations is the servicelevel. When we say ‘servicelevel’ in this context, we are referring to what is rooted in the classic call center measure: what percentage of calls is answered within a certain time period.
Why are you measuring servicelevels that way? One way that consumer satisfaction finds its way into operations is the servicelevel. When we say ‘servicelevel’ in this context, we are referring to what is rooted in the classic call center measure: what percentage of calls is answered within a certain time period.
Here are some examples of how raw data can inform reporting: Hold time is an analytic that informs reporting on abandonmentrates and servicelevel. Number of calls is an analytic that informs reporting on agent occupancy rate. ”) to a more formal net promoter score survey. Abandonmentrate.
After-call surveys are a great way to achieve this. Your call center platform will give you plenty of quantitative data, such as abandonmentrates and servicelevels, which you can compare against your qualitative data, which includes customer feedback and surveys.
According to research from the Harvard Business Review, 71% of managers surveyed said employee engagement is an important factor in the overall success of a company. According to the Harvard #Business Review, 71% of managers surveyed said #employeeengagement is an important factor in the overall success of a company. Click To Tweet.
Five key KPIs help optimize efficiency: Average Handle Time (AHT) , ServiceLevel , AbandonmentRate , Occupancy Rate , and Average Speed of Answer (ASA). Ways to Improve ServiceLevels: Use workforce management tools for precise staffing predictions. Empower agents to resolve issues on first contact.
Measure CSAT through surveys sent after an email interaction, or as a quarterly email blast. These survey responses then give you a sense of how happy your customers are. How to Measure it: Number of satisfied customers (4 and 5) / Number of survey responses) x 100 = % of satisfied customers. ServiceLevel.
This is typically an email survey that asks 4-6 regarding the interaction, professionalism, ownership, resolution, NPS and ’top box’ are the usual themes. The customer feedback survey data allows us to add other contractual metrics such as FCR, VoC, CSAT, NPS etc. The old Contact Center Outsourcing (CCO) model is broken.
FACT: According to Zippia, only 48% of employees surveyed believe their company’s leadership abilities are “high-quality”. Determine what your employees think of your leadership skills with an anonymous survey. Call volume Call abandonmentrate. Average handling time (AHT). First call resolution. Net promoter score (NPS).
The CCO’s employ forecasts which are matched to the contractual KPI’s, most commonly, ServiceLevel (the percentage of contacts answered within a specified time-period, which often varies by channel), Average Handle Time and Abandonrate. None of these metrics speak to the quality of the interaction.
Quality of Service. ServiceLevel: Servicelevel refers to the percentage of calls being answered within a given time frame and measures the overall performance of how accessible your service is for customers. Tip: Call center servicelevels can be disconcerting and need to be measured with the right method.
It is based on an extensive survey of customer experience, contact center, operations, information technology, marketing and business development professionals. Respondents to the survey ranked the top six objectives in the following order, with the most important first. 18% say they outsource some operations.
AbandonRate. When this happens, a customer is more likely to abandon the call before they speak with a contact center agent. Abandonrate refers to the percentage of calls made into the customer support center where the customer hangs up before they ever talk to an agent. ServiceLevel.
Enabling outbound agents to fill in on inbound lines when call volumes spike, for example, has offered valuable options for enhancing call center metrics, like servicelevels and abandonmentrates. As the omnichannel contact center has blossomed the variety of contact types to manage has multiplied.
AbandonmentRate. This is known as the abandonmentrate. High levels could mean your inbound calls are experiencing too high of wait times or your agents aren’t resolving issues fast enough. Reduce your inbound call abandonmentrate to increase customer retention. ServiceLevel.
The only way to sustain servicelevels is to learn what’s really happening in your contact center. Here’s how you can use customer service data to inform your decisions and deliver the customer experience your customers beg for this year. Your hold times, your servicelevels, and your abandonrates all fall into this category.
Remote work is a benefit that’s highly important to customer service agents. Agents in our survey were resounding in their praise for remote work arrangements. A sprawling 2022 survey of more than 20,000 knowledge workers by Microsoft offers some insights. Why bring agents back when even managers are satisfied with it?
Average Call AbandonmentRate. The average call abandonmentrate (ACAR) indicates the number of customers that abandon calls if they wait on hold for too long. If they have to transfer several times, however, they’re more likely to abandon the line. ServiceLevel Scores.
Basic KPIs There are many KPIs, but some of the most commonly used customer service metrics follow. Abandonrate. The inverse of the answer rate. Abandonrate = calls abandoned ÷ (calls abandoned + calls answered). Servicelevel (SLA) sets benchmarks for future performance.
During these peaks, the Average Speed to Answer (ASA) goes up increasing abandonrate. Call queue management relates to maintaining/improving the servicelevel of a call center (implications of poor response time). Reduced Call AbandonmentRates. Good First Call Resolution Rates. Queue Callback.
The rate at which customers hang up calls is called the abandonmentrate. The formula for the abandonmentrate is the total number of calls that enter your queue, divided by the number of calls that drop. . Lower your call abandonmentrate and increase your chances of creating brand loyalty. .
If you’re not making metrics and real-time data clear and digestible for your team, you’re putting your customer service experience at risk. To help, we’re sharing three example dashboards you can use with agents and team leads to fuel better servicelevels. Check out our 7 examples of customer surveys that get responses.
In this post: Average Handling Time Customer Satisfaction ServiceLevel First Contact Resolution Call AbandonmentRate Percentage of Calls Blocked Call Transfer Rate Wrap-up Time Customer Effort Score Average Idle Time. CSat is a crucial CX metric that gauges how customers truly feel about your service.
You can determine your CSAT by running surveys either generally, or related to a specific interaction or product purchase. Gather regular feedback through customer surveys. Regular customer surveys and other customer feedback mechanisms will help your company get a balanced view and understanding of customer feedback.
In this article we’ve decided to present you 20 call center metrics that will make it easier for you to gain powerful insights into the sales call performance and keep an eyeon your customer service efforts. Call AbandonmentRate. Occupancy Rate. Transfer rate. ServiceLevel. Contact Rate.
Formula: Pro Tip: Break call volume into categoriescalls managed by agents and self-service options (like interactive voice response systems). Average Call AbandonmentRate (ACAR) If calls answered are low and calls blocked or abandoned are high, customer behavior signals frustration.
Formula: (Total number of incoming + outgoing calls) in a given period Pro Tip: Break call volume into categoriescalls managed by agents and self-service options (like interactive voice response systems). Typically gathered through an after-call survey, CSAT reflects whether your call center agents delivered on customer expectations.
Call AbandonmentRate The call abandonmentrate is the rate at which your customers drop out of the call waiting queue and abandon the service call. If the call abandonmentrate at your business is high, it means your contact center may be inefficient at resolving queries.
Quality of service : When working with an inbound call center, you need one that will provide exceptional quality of service for your customers. Look closely at the call center’s customer satisfaction scores, previous servicelevel agreements (SLAs), and performance metrics.
AbandonRate. When this happens, a customer is more likely to abandon the call before they speak with a contact center agent. Abandonrate refers to the percentage of calls made into the customer support center where the customer hangs up before they ever talk to an agent. ServiceLevel.
If a call center has low abandonmentrates, it generally means that the agents are answering calls quickly, routing is optimized properly and the team is accurately staffed. Level of Service and Customer Satisfaction. Servicelevel can be defined as the percentage of calls answered within a specified timeframe.
3 Call abandonmentrate. Callers tend to abandon the queue when they have to wait for too long. Keep track of how often this happens by measuring your call abandonmentrate – that’s the percentage of callers who quit while waiting. 4 Servicelevel. 5 First contact resolution (FCR).
The purpose of Sentiment is to understand the customer on a whole new level: their satisfaction with their service experience, their emotional state and their experiences across the customer lifecycle. Customer Satisfaction (or CSAT) is not a new concept; it is an established service metric that has been widely adopted for decades.
Call AbandonmentRate. The number of callers that hang up before connecting with an agent is a measure of your call abandonmentrate. It is an essential servicelevel KPI you can't overlook. Call abandonmentrate can also be referred to as the rate at which callers hang up prematurely.
In the call center, it’s often hard to determine what the right servicelevel is – and servicelevels are naturally different on different channels. For some good examples, see Shai’s recent blog post on the subject: “Manager’s Guide to Call Center ServiceLevels. Really listen.
Sporadic reporting and once-a-month measurements won’t give you the intel you need to make clear decisions on how to improve customer service and agent performance. Metrics like ServiceLevel and First Contact Resolution are tough for agents to influence. Build omnichannel into your customer service strategy.
We organize all of the trending information in your field so you don't have to. Join 34,000+ users and stay up to date on the latest articles your peers are reading.
You know about us, now we want to get to know you!
Let's personalize your content
Let's get even more personalized
We recognize your account from another site in our network, please click 'Send Email' below to continue with verifying your account and setting a password.


Let's personalize your content