This site uses cookies to improve your experience. To help us insure we adhere to various privacy regulations, please select your country/region of residence. If you do not select a country, we will assume you are from the United States. Select your Cookie Settings or view our Privacy Policy and Terms of Use.
Cookie Settings
Cookies and similar technologies are used on this website for proper function of the website, for tracking performance analytics and for marketing purposes. We and some of our third-party providers may use cookie data for various purposes. Please review the cookie settings below and choose your preference.
Used for the proper function of the website
Used for monitoring website traffic and interactions
Cookie Settings
Cookies and similar technologies are used on this website for proper function of the website, for tracking performance analytics and for marketing purposes. We and some of our third-party providers may use cookie data for various purposes. Please review the cookie settings below and choose your preference.
Strictly Necessary: Used for the proper function of the website
Performance/Analytics: Used for monitoring website traffic and interactions
How to Reduce WaitTimes and Improve Customer Satisfaction in Call Centers How to Reduce WaitTimes and Improve Customer Satisfaction in Call Centers is a critical focus for businesses aiming to enhance customer experience and boost operational efficiency. Why Reducing WaitTimes is Critical for Customer Satisfaction 1.
How to Measure: CSAT = (Number of Satisfied Customers / Total Survey Responses) 100 4. Call AbandonmentRate Definition: The percentage of calls disconnected by customers before reaching an agent. How to Measure: Call AbandonmentRate = (Abandoned Calls / Total Incoming Calls) 100 6.
This week we feature an article by Christa Heibel who writes about how important employee feedback is to a successful customer service experience and high CSAT ratings. – Shep Hyken. In my past experience as both a consultant and owner/operator of a BPO, I understand that CSAT surveys tend to get all the attention. What You Can Do.
Prioritize VIP customers or repeat callers to reduce waittimes. How to Gather Feedback: Conduct post-call surveys to gauge satisfaction. Reduce WaitTimes with Efficient Staffing Long waittimes frustrate customers and can harm your brands reputation. Monitor online reviews and social media comments.
By implementing best practices, businesses can improve their first-call resolution (FCR), reduce waittimes, and enhance overall customer engagement. Enable real-time call monitoring to identify areas of improvement. Reduce Customer WaitTimes Long waittimes are a major cause of dissatisfaction.
Take your pick — first call resolution (FCR) , abandonrate , customer satisfaction (CSAT) , and more. ASA refers to the average response time or amount of time that it takes for an agent to answer a call. Abandonrate. Sometimes, a call center is overwhelmed or understaffed, resulting in long waittimes.
Average handle time (AHT): Tracks how long an agent takes to complete a customer service interaction. Call abandonmentrate: Expresses the percentage of calls customers hang up on before speaking with an agent. Increased operational efficiency Contact center analytics can drive operational efficiency using data-driven insights.
If they are kept waiting too long, they may hang up and abandon the call, resulting in missed opportunities for providing excellent customer service. These are five strategies to reduce abandonrates in your call center and enhance the customer experience. Importance of Low Call AbandonRates?
Average handle time (AHT): If an agent’s AHT is ten minutes at the start, you could develop a goal to lower it to three minutes, for example. . Customer satisfaction score: Conduct customer surveys through Fonolo’s interactive voice response (IVR) to discover customer satisfaction scores. Some ways to garner feedback include: .
Plus, you can draw a clear line of distinction between a shorter AHT and reduced customer waittimes. One way to gauge customer satisfaction is using surveys that contain OSAT related questions, such as “What was your overall satisfaction with the experience?” asking them to rate their entire experience on a scale of 1 to 10.
Call abandonmentrate. It’s been two hours and that hold music has repeated countless times. As customers, we don’t have all day to wait on a call with customer service. To track your abandonmentrate, divide your number of abandoned interactions by your total inbound interactions.
According to a recent Zendesk survey , around 42% of customers say their definition of bad support is when they get stuck in an automated system that makes it hard to reach an agent. Long waittimes? DID YOU KNOW? What makes a great call center IVR script? It collects valuable information. It includes call-back options.
That’s because nearly 40% of current incoming call volume can be handled entirely with automated, self-service channels , according to a business leader survey from Gartner. And, there’s still time to get these implemented before the height of the Q4 crunch…if you get started right away.
Were their waittimes 30 seconds or 10 minutes? A report by Natterbox, NICE InContact, Jabra, and Serenova that surveyed 250 contact centers found that there are, in fact, a wide range of service levels in use today, ranging from 50/40 to 100/180. ” Here’s a great case study on a company that reduced abandonmentrates.
A recent report by Natterbox, NICE InContact, Jabra, and Serenova that surveyed 250 contact centers found that there are, in fact, a wide range of service levels in use today, ranging from 50/40 to 100/180. longer) target answer times and stricter percentages. Compare higher abandonment groups to a control group for this one.
A new survey from Call Centre Helper confirms that the reign of 80/20 continues, but there is more to the story. The report surveyed over 250 contact centers, asking questions about how companies are delivering customer service over voice, email, chat, and social media. Were their waittimes 30 seconds or 10 minutes?
First call resolution rate: The percentage of calls that are resolved on the first call. Average speed of answer: The average time it takes for an agent to answer a call. Abandonmentrate: The percentage of calls that are abandoned by customers before speaking to an agent.
Five key KPIs help optimize efficiency: Average Handle Time (AHT) , Service Level , AbandonmentRate , Occupancy Rate , and Average Speed of Answer (ASA). Optimize Average Handle Time (AHT) AHT measures the average time spent on a customer interaction, including talk time, hold time, and after-call work.
These systems can also detect when waittimes exceed acceptable thresholds and alert supervisors in real-time. They utilize key performance indicators (KPIs) such as average handle time and customer satisfaction scores to help agents and managers make informed decisions, identify issues, and enhance operational efficiency.
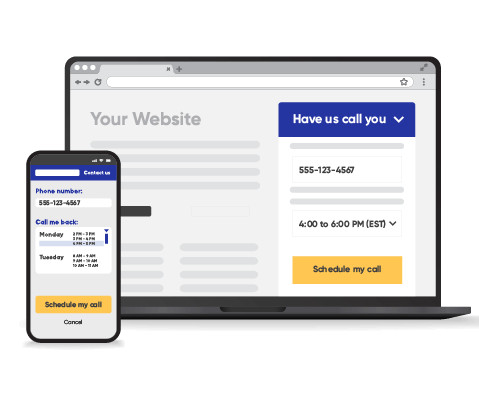
If your company has long waittimes, and if you don’t have the budget to staff up, you should consider adding a call-back solution. Simply put, replacing hold-time with a call-back is the closest thing to a “magic bullet” that you’ll find in the call center world. 2) Reduce AbandonRates.
This is typically an email survey that asks 4-6 regarding the interaction, professionalism, ownership, resolution, NPS and ’top box’ are the usual themes. Together this makes for an effective quality program, without expensive and time-consuming calibration and ambiguous results.
Organizations gather customer experience data through CSAT (customer satisfaction) surveys that are built into their help desk ticketing systems. Conducting such surveys helps them in finding out the challenges faced by customers over time. In such times, it becomes imperative to tap into your gold mine – your agents.
Their survey revealed that a bad IVR experience makes situations worse and turns neutral customers into dissatisfied ones. But visual IVR and call-backs are also a tool to reduce cost-per-call through three mechanisms: Reduced AbandonRateAbandonrate is a metric that many call center managers watch closely.
FACT: According to Zippia, only 48% of employees surveyed believe their company’s leadership abilities are “high-quality”. Determine what your employees think of your leadership skills with an anonymous survey. Average handling time (AHT). Call volume Call abandonmentrate. First call resolution.
accompanied by a survey scale. For maximum effectiveness, implement your CSAT survey in the live chat window and set it to automatically pop up once an agent marks a chat as concluded. CSAT surveys can also be sent to customers via email after a live chat experience. The reason why is simple: they will tell you directly.
Call abandonmentrate. Call waittime. — — — — — — — — — — — —. This metric looks at the total number of times your customers interact with your support team across any channel that you support. . — — — — — — — — — — — —. Call abandonmentrate. What is call abandonmentrate?
The goal is to have the lowest average call queue time possible, which will result in more effective service and happier customers. It is imperative that call center queues be consistently monitored and actions be taken to reduce queue waittime in order to decrease customer frustration and call abandonment.
Having more or less staff at the right times can decrease overall contact center costs, improve agent productivity by decreasing burnout potential , decrease wait-times for customers, and more. Fonolo’s Voice Call-Backs smooth out call spikes, lower abandonrates, and improve the customer experience overall.
Intelligent routing that is optimized for your customer journey can lower abandonrates, reduce queue times for calls, and provide tailored call-back options for times of particularly high call volume. Support for Busy Times and Disaster Recovery. Measuring Customer Satisfaction.
Customers receive fast, accurate responses, reduced misrouting, and reduced waittimes. When human intervention is required, intelligent routing means customers are matched to agents quickly, reducing waittimes. Every voice conversation makes the technology more sophisticated and better at answering customer questions.
Call analytics are useful tools for predicting call volume and minimizing waittimes. But, during the busiest of times, a call queue can save the day! This prevents them from getting frustrated by unusually long waittimes. The rate at which customers hang up calls is called the abandonmentrate.
Queue WaitTime Consumers almost universally complain about phone queue waittimes , particularly when it comes to a government agency like the IRS, but any extended wait will put them in the wrong mood for a successful transaction. Waittime should be one of your most important call center KPI benchmarks.
Keep your average response time low. A high response time can lead to high abandonmentrates and customer dissatisfaction. Kicking off our list of live chat best practices for customer service, we’ve outlined some key steps you can take for a faster response time: 2. Be clear about waittime.
This can be done in a variety of ways, including with Customer Satisfaction Surveys that are sent out after a call or chat. Tracking first call resolution ensures that you are satisfying customers in the shortest amount of time, without the need for any follow-up. This includes any waittime, as well as time spent with an agent.
Two primary ways to reduce this number include: reducing overall ticket volume increasing the number of agents, or efficiency of agents Working with an outsourcing provider can help you scale your call center effectively so you can reduce waittimes and improve customer service, while still working within your current budget.
Average Call AbandonmentRate. The average call abandonmentrate (ACAR) indicates the number of customers that abandon calls if they wait on hold for too long. If they have to transfer several times, however, they’re more likely to abandon the line. Average Time in Queue.
To put it simply, callback solves the customer-service problems that grow out of customers waiting on hold. A solution is something that solves a problem, and, to put it simply, callback solves the problems that grow out of customers waiting on hold. Better Solution = Better Metrics.
AbandonmentRate. This is known as the abandonmentrate. High levels could mean your inbound calls are experiencing too high of waittimes or your agents aren’t resolving issues fast enough. Reduce your inbound call abandonmentrate to increase customer retention. Handle Time.
CSAT is measured at the end of a customer survey, using a five-point scale. This is because most CX practitioners believe that using the two highest values on feedback surveys is the most accurate predictor of customer retention. Average Call AbandonmentRate If customers are waiting on hold too long, they are likely to abandon calls.
How to Eliminate Hold Time in Your Contact Center: What’s the difference between average speed of answer and average waittime? Why is average waittime an important metric? How to Calculate Hold Time in a Call Center. What causes long call center hold times?
You might want to look at Average Speed to Answer (ASA) and AbandonmentRate (AR) along with SLAs. Tip: You can tie your Customer Satisfaction surveys to key moments such as customer onboarding, after a customer support interaction, or a contract renewal. Tip: Long hold times are usually the root cause of high abandonrates.
Response times and waittimes. Measure how quickly your staff responds to inbound calls along with waittimes. That’s why, typically, the higher your transfer rate, the lower your customer satisfaction rating will be. Abandonrate. Call duration.
By predicting the average call answer time and agent availability, the predictive dialer modifies the dialing rate. Predictive dialer works efficiently in reducing agent/customer waittime or calls drop ratio.
If a call center has low abandonmentrates, it generally means that the agents are answering calls quickly, routing is optimized properly and the team is accurately staffed. Therefore, it is important to analyze the Average Speed of Answer (ASA) , which is nothing but the average time taken by agents to answer inbound calls.
We organize all of the trending information in your field so you don't have to. Join 34,000+ users and stay up to date on the latest articles your peers are reading.
You know about us, now we want to get to know you!
Let's personalize your content
Let's get even more personalized
We recognize your account from another site in our network, please click 'Send Email' below to continue with verifying your account and setting a password.


Let's personalize your content