This site uses cookies to improve your experience. To help us insure we adhere to various privacy regulations, please select your country/region of residence. If you do not select a country, we will assume you are from the United States. Select your Cookie Settings or view our Privacy Policy and Terms of Use.
Cookie Settings
Cookies and similar technologies are used on this website for proper function of the website, for tracking performance analytics and for marketing purposes. We and some of our third-party providers may use cookie data for various purposes. Please review the cookie settings below and choose your preference.
Used for the proper function of the website
Used for monitoring website traffic and interactions
Cookie Settings
Cookies and similar technologies are used on this website for proper function of the website, for tracking performance analytics and for marketing purposes. We and some of our third-party providers may use cookie data for various purposes. Please review the cookie settings below and choose your preference.
Strictly Necessary: Used for the proper function of the website
Performance/Analytics: Used for monitoring website traffic and interactions
The Types of Data for Your Metrics. Peppers says there are two different types of data that feed your metrics: Voice of Customer (VOC) Data: Peppers calls these metrics interactive data, meaning your customer interacts with you through a poll. VOC Data Can Be Deceiving Where Numbers Are Not.
What began as an exploration of contact center reporting, soon became a bigger exercise in the ever-expanding world of BigData, and that has inevitably taken me into the adjacent galaxy of BI – business intelligence. The cloud has changed everything, and that brings us to BigData. The mind boggles.
What is bigdata? Bigdata" has been defined in many different ways and seems to most often refer to the sheer volume of data, but for the purpose of this article, I''m going to refer to the data sources. You need a way to bring the data together in one place so that it can be analyzed in a sane way.
Through advanced econometric analysis, we aim to illuminate the deep connection between ESG initiatives and Corporate Financial Performance (CFP). Furthermore, the integration of digital technologies, including artificial intelligence, blockchain, and bigdata, augments these ESG capabilities.
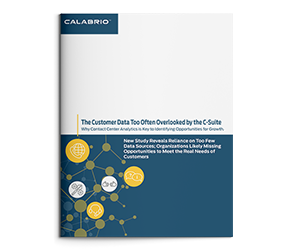
A recent Calabrio research study of more than 1,000 C-Suite executives has revealed leaders are missing a key data stream – voice of the customer data. Download the report to learn how executives can find and use VoC data to make more informed business decisions.
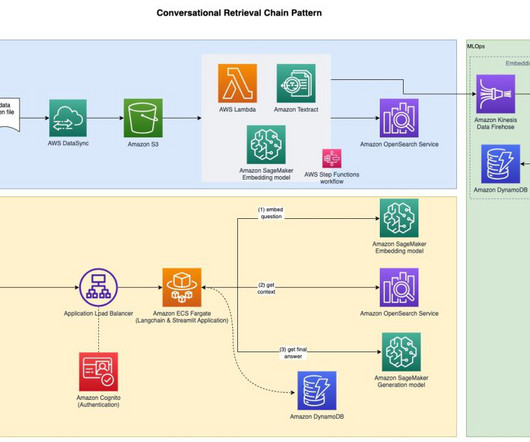
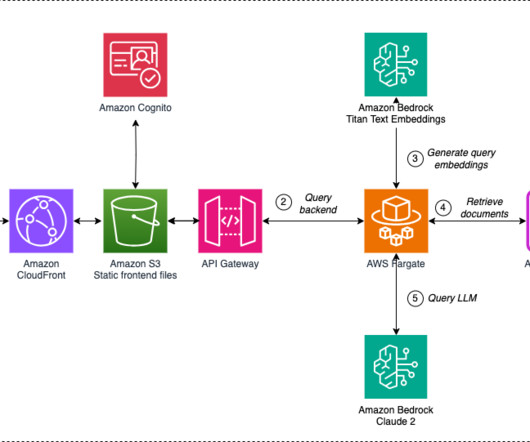
In this post, we show you how F1 created a purpose-built root cause analysis (RCA) assistant to empower users such as operations engineers, software developers, and network engineers to troubleshoot issues, narrow down on the root cause, and significantly reduce the manual intervention required to fix recurrent issues during and after live events.
Bigdata is getting bigger with each passing year, but making sense of trends hidden deep in the heap of 1s and 0s is more confounding than ever. As metrics pile up, you may find yourself wondering which data points matter and in what ways they relate to your business’s interests.
BigData creates big problems. Moreover, it’s surprising how many organizations can’t tell you how improving metrics identified by the employed measures translates to providing value to the organization. One of the biggest problems is what to do with it now that you have it.
Large Language Models (LLMs) have revolutionized the field of natural language processing (NLP), improving tasks such as language translation, text summarization, and sentiment analysis. Overview of solution The first thing to consider is that different metrics require different computation considerations.
Many are actively collecting Voice of Customer (VOC) data through surveys, feedback management, analytics and market research relating to customer retention, loyalty, brand equity and satisfaction. As a result, they are able to create enormous streams and bases of data – known, collectively, as “BigData”.
They serve as a bridge between IT and other business functions, making data-driven recommendations that meet business requirements and improve processes while optimizing costs. That requires involvement in process design and improvement, workload planning and metric and KPI analysis. Andrew Tillery. MAPCommInc. Kirk Chewning.
A 2015 Capgemini and EMC study called “Big & Fast Data: The rise of Insight-Driven Business” showed that: 56% of the 1,000 senior decision makers surveyed claim that their investment in bigdata over the next three years will exceed past investment in information management. ” Bold words indeed!
Technology is being blamed for disrupting businesses, but in most cases these companies have simply not adapted to this new data-rich world. If you're drowning in data, perhaps you have still not adapted to today's data-rich world. BigData #Analysis #Customer #CustomerUnderstanding Click To Tweet.
Most companies collect small and bigdata to do more targeted marketing selling, and use metrics like customer satisfaction, indices, NPS and/or CES to reward or punish employees. Create human emotions and memories in transactions and relationships. The Four Principles of CX Design.
As a bonus, it’s available indefinitely for future analysis and decision making. How Can Companies Use All This Data? Unstructured data: Unstructured data can be defined as “information, in many different forms, that doesn’t hew to conventional data models.” The Process of Using BigData.
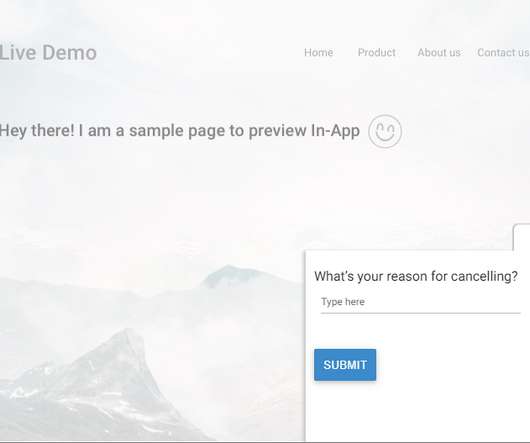
However, at the same time, it is also one of the CX metrics that cannot be measured straightforwardly. Some of the key benefits of in-app surveys related to service quality metrics are: Customer validation for specific offerings, services, and features. Monitoring Service Quality Metrics. Let’s check them out. Let’s find out!
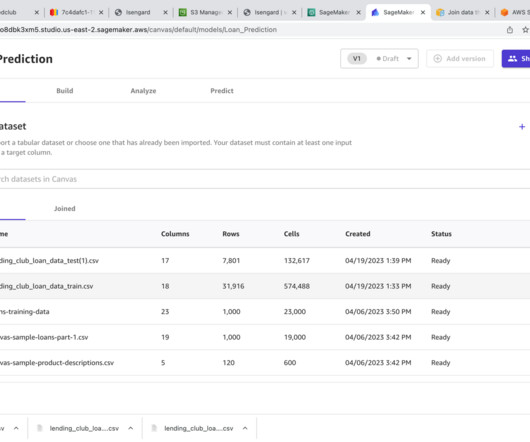
Run a Data Quality and Insights report After you import the dataset, the SageMaker Data Wrangler data flow will open. You can run a Data Quality and Insights Report, which will perform an analysis of the data to determine potential issues to address during data preparation. Choose Create model.
However, an analysis run by IBM on research carried out in the UK last year by the Callcredit Information Group gives a different reason. They found that the majority of marketers is feeling overwhelmed by all this data. It saddens me that despite the constant flow of data into companies they still lack insights into their customers.
Root cause analysis means looking at all your data to find out what is really causing the problems that your customers are experiencing. Because of this root cause analysis, the engineering team redesigned the headrest fastening system. It’s not always easy to find the root cause when you first notice a change in your metrics.
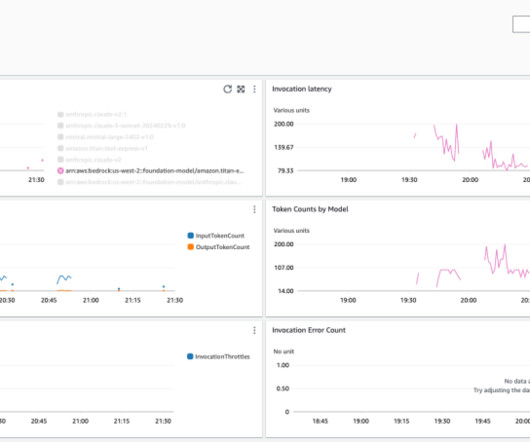
A new automatic dashboard for Amazon Bedrock was added to provide insights into key metrics for Amazon Bedrock models. From here you can gain centralized visibility and insights to key metrics such as latency and invocation metrics. Optionally, you can select a specific model to isolate the metrics to one model.
Amazon SageMaker Model Monitor allows you to automatically monitor ML models in production, and alerts you when data and model quality issues appear. SageMaker Model Monitor emits per-feature metrics to Amazon CloudWatch , which you can use to set up dashboards and alerts. Enable CloudWatch cross-account observability.
After you import the dataset, you can first look at the Data Quality Insights Report to see recommendations from SageMaker Canvas on how to improve the data quality and therefore improve the model’s performance. In the flow, choose the options menu (three dots) for the node, then choose Get data insights.
To achieve this, companies want to understand industry trends and customer behavior, and optimize internal processes and data analyses on a routine basis. When looking at these metrics, business analysts often identify patterns in customer behavior, in order to determine whether the company risks losing the customer. Choose Visualize.
And finally, how well is our reference data covering the questions being asked? In this post, you’ll learn about some of the considerations for embedding vector analysis and detecting signals of embedding drift. The question and the reference data then go into the prompt for the LLM.
It allows for effective comparison and analysis of different approaches, leading to informed decision-making. He entered the bigdata space in 2013 and continues to explore that area. SageMaker Experiments is a capability of SageMaker that lets you create, manage, analyze, and compare your ML experiments.
For example, when financial institutions use ML models to perform fraud detection analysis, they can use low-code and no-code solutions to enable rapid iteration of fraud detection models to improve efficiency and accuracy. However, ML governance plays a key role to make sure the data used in these models is accurate, secure, and reliable.
Metrics drive the success of any call center. In today’s IoT (Internet of Things) landscape, analyzing bigdata is now a crucial factor that must be embraced by call centers for collections, customer service, and sales. The predictive analysis goes far beyond the random spot-checking that a quality assurance team provides.
Bigdata can be overwhelming. It’s just…well, big. And while customer experience management (CEM) activities should be data-driven, it is hard to figure out which data to use. Every industry, and every company, will have different types of data to look at. Focus on high volume sources to demonstrate ROI.
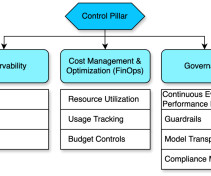
Provide control through transparency of models, guardrails, and costs using metrics, logs, and traces The control pillar of the generative AI framework focuses on observability, cost management, and governance, making sure enterprises can deploy and operate their generative AI solutions securely and efficiently.
We also demonstrate how to use the generative AI capabilities of SageMaker Canvas to speed up your data exploration and help you build better ML models. Use case overview In this example, a health-tech company offering remote patient monitoring is collecting operational data from wearables using Splunk. Choose Create.
In 2011, a McKinsey Global Institute report celebrated the potential for bigdata: “…we are on the cusp of a tremendous wave of innovation, productivity, and growth, as well as new modes of competition and value capture…”. Despite increased spending, many are failing in their efforts to become data-driven. Partnership.
Root cause analysis means looking at all your data to find out what is really causing the problems that your customers are experiencing. Because of this root cause analysis, the engineering team redesigned the headrest fastening system. It’s not always easy to find the root cause when you first notice a change in your metrics.
Root cause analysis means looking at all your data to find out what is really causing the problems that your customers are experiencing. Because of this root cause analysis, the engineering team redesigned the headrest fastening system. It’s not always easy to find the root cause when you first notice a change in your metrics.
In this post, we’ll cover a couple of ways to use bigdata to assist in predictive customer service attempts. When it comes to customers, there’s all sort of data to review, but as far as customer service is concerned, it’s vital that companies know the issues customers are having at various stages of their product usage.
The DITEX department engaged with the Safety, Sustainability & Energy Transition team for a preliminary analysis of their pain points and deemed it feasible to use generative AI techniques to speed up the resolution of compliance queries faster. However, a manual process is time-consuming and not scalable.
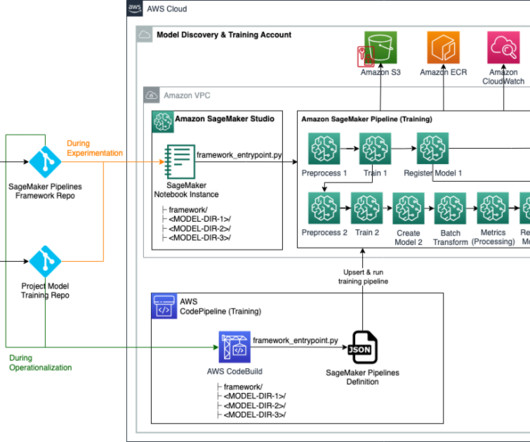
framework/modelmetrics/ – This directory contains a Python script that creates an Amazon SageMaker Processing job for generating a model metrics JSON report for a trained model based on results of a SageMaker batch transform job performed on test data. The model_unit.py script is used by pipeline_service.py The pipeline_service.py
However, an analysis by IBM on some research carried out in the UK by the Callcredit Information Group gives a different reason. They found that the majority of marketers are feeling overwhelmed by all this data. It surprises me that despite the constant flow of data into companies they still lack insights into their customers.
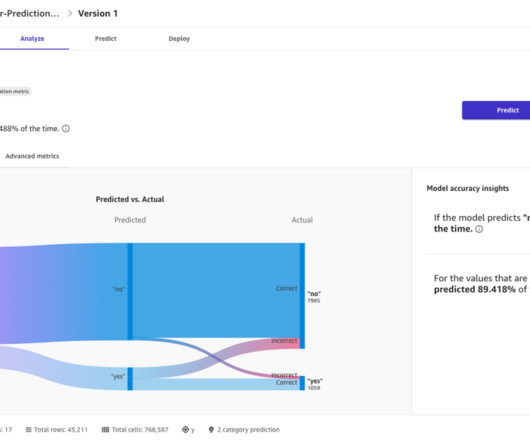
Business analysts play a pivotal role in facilitating data-driven business decisions through activities such as the visualization of business metrics and the prediction of future events. Thereafter, we send the data to QuickSight for further analysis. Then they can create predictive dashboards with the data.
This evolution has been driven by advancements in machine learning, natural language processing, and bigdata analytics. With capabilities like sentiment analysis, AI can detect customer moods and adjust interactions accordingly, ensuring that the customer feels heard and understood throughout their journey.
This evolution has been driven by advancements in machine learning, natural language processing, and bigdata analytics. With capabilities like sentiment analysis, AI can detect customer moods and adjust interactions accordingly, ensuring that the customer feels heard and understood throughout their journey.
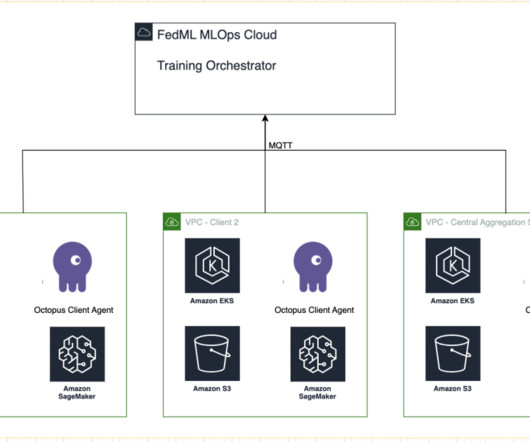
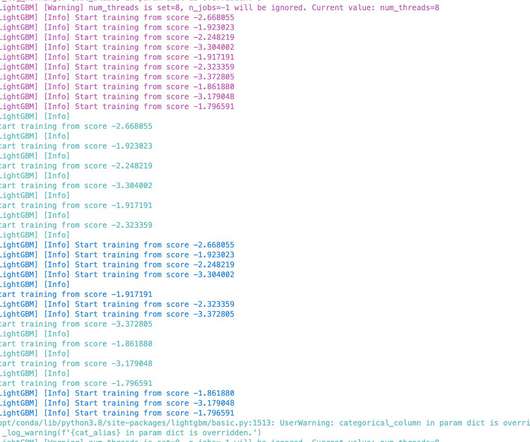
Distributed training is a technique that allows for the parallel processing of large amounts of data across multiple machines or devices. By splitting the data and training multiple models in parallel, distributed training can significantly reduce training time and improve the performance of models on bigdata.
With the use of cloud computing, bigdata and machine learning (ML) tools like Amazon Athena or Amazon SageMaker have become available and useable by anyone without much effort in creation and maintenance. The predicted value indicates the expected value for our target metric based on the training data.
Improving Products and Services Through BigData. Bigdata, which is the vast amount of information collected from different customer touchpoints, has already fueled the growth of the financial industry. . In the past, the biggest challenge wasn’t the collection, but the analysis and interpretation of this data.
After the predictors have been created, we evaluated their quality metrics in the predictors dashboard. For customized evaluation and analysis, you can also export the forecasted values to evaluate predictor quality metrics. Together, these achievements helped our customer progress toward their ESG initiatives.
We organize all of the trending information in your field so you don't have to. Join 34,000+ users and stay up to date on the latest articles your peers are reading.
You know about us, now we want to get to know you!
Let's personalize your content
Let's get even more personalized
We recognize your account from another site in our network, please click 'Send Email' below to continue with verifying your account and setting a password.


Let's personalize your content