This site uses cookies to improve your experience. To help us insure we adhere to various privacy regulations, please select your country/region of residence. If you do not select a country, we will assume you are from the United States. Select your Cookie Settings or view our Privacy Policy and Terms of Use.
Cookie Settings
Cookies and similar technologies are used on this website for proper function of the website, for tracking performance analytics and for marketing purposes. We and some of our third-party providers may use cookie data for various purposes. Please review the cookie settings below and choose your preference.
Used for the proper function of the website
Used for monitoring website traffic and interactions
Cookie Settings
Cookies and similar technologies are used on this website for proper function of the website, for tracking performance analytics and for marketing purposes. We and some of our third-party providers may use cookie data for various purposes. Please review the cookie settings below and choose your preference.
Strictly Necessary: Used for the proper function of the website
Performance/Analytics: Used for monitoring website traffic and interactions
In the world of contact center metrics, servicelevel has always held a special place. What is the Purpose of ServiceLevels? Call center servicelevels are, broadly speaking, a commitment to a particular average speed of answer, or ASA. Where Did the 80/20 ServiceLevel Rule Come From?
Servicelevels were at 90% and quality scores were at 98%. Jason Mercer-Pottinger was given a seemingly impossible task; take over a Tier 1 contact center from a 3rd-party BPO with no trainers, no supervisors, and no experienced agents while at the same time decreasing costs and improving quality. And do it all in 120 days.
In the wide world of call center metrics, “servicelevel” has always held a special place. The longevity of servicelevel is astonishing when one considers the enormous changes that have occurred in customer service technology over the last few decades. servicelevel means 80% of calls answered in 20 seconds.
In the world of contact center metrics, “servicelevel” has always held a special place. Call center servicelevels are, broadly speaking, a commitment to a particular average speed of answer, or ASA. And for many call center managers, maintaining these servicelevels is a top priority.
Like many expanding businesses, they were facing increasing pressure on their customer service team. It’s a pattern I’ve seen countless times when servicelevels are strained, the reaction is often to replace the entire system. The natural response? Invest in new technology.
Mapping out the ‘ease of doing business’ and essentially removing any barriers to service . Creating an “Environment of Self Service” — XGS deployed a CRM system as well as an improved and expanded customer portal to capture and improve servicelevels .
Overview Servicelevel is one of the most important metrics for a contact center to measure and manage and has been in place since contact centers evolved. Organizations are missing opportunities to view this metric differently to manage customer service delivery and its associated costs more effectively. Is that okay?”
These include: Inaccurate or incomplete service delivery: Falling short of promised servicelevels, whether through errors, omissions, or a failure to fully understand customer needs. Documented Procedures: Document all servicelevel agreements (SLAs) and operating procedures clearly and concisely.
If most call center teams had to pick a “North Star” it would be servicelevel, which measures the length of time callers wait to reach an agent. It’s kind of surprising that, despite all the enormous changes that have occurred in customer service technology, the dominant metric remains servicelevel. Definitions.
Sentiment analysis Sentiment analysis tools use NLP to gauge customer emotions during interactions. By analysing tone, language, and keywords, AI-powered sentiment analysis tools can determine exactly how customers feel, detecting frustration or satisfaction in real time.
Based on this analysis, the decision engine will decide the best course of action to take. For example, a business might have a rule that all customers who call the customer service line should be offered a discount. This would allow businesses to automate customer service and still provide a high level of personalised service.
Bottom Line: The optimal role of a business analyst in call center operations is to improve the customer service experience by optimizing operations through trend and data analysis and identifying and implementing strategies based on the data to improve efficiencies within the call center. Andrew Tillery. MAPCommInc. Lynn Hope Thomas.
Are you seeking to provide consistent ServiceLevel during temperature-related events? We quickly uncovered through the analysis that the summer period did not align to a specific date or holiday as many believed. Based on our analysis findings, we created a sophisticated forecasting algorithm using this new approach.
Sentiment Analysis Gets Smarter: The Shift to GenAI For years, sentiment analysis in contact centers relied on a rules-based approach. With Calabrio ONE , weve moved beyond basic keyword matching to a GenAI-driven sentiment analysis that offers a much deeper, more accurate understanding of customer emotions. Insight Is Rare.
A shorter response time helps with customer engagement and servicelevel agreements (SLAs). Use Spreadsheets: Instead of using the traditional spreadsheet to organize and track data, look for a great monitoring platform that offers data analysis and reporting tools.
Management staff are freed from error-prone tasks such as updating and manipulating spreadsheets for rosters, holidays, and performance analysis. Applying similar analysis to back office operations enables better anticipation and planning for variations in demand, as well as more efficient task distribution.
Unhappy customers waiting days without Internet service or a working coffee machine. For example: Joe works for an office equipment supplier that has a guaranteed four-hour ServiceLevel Agreement (SLA) with its customers. The post Technician Dispatch in 2021: 4 Fresh Approaches to Cost appeared first on TechSee.
Slight adjustments to agents and teams that might have gone unnoticed otherwise can dramatically impact the servicelevel. contributions by utilizing historical data on servicelevel, occupancy rate and other?metrics And the beauty is its scalability. . Supervisors and agents can maximize their?contributions
Defining Call Center Analytics Call center analytics refers to the collection, measurement, and analysis of call center data to improve performance and customer experience. While automation can process this data efficiently, human analysis remains crucial. Don’t automate analysis to the point of removing human judgment.
In practice, agents accessing an open customer care case must sift through increasingly complicated data sets and perform a time-consuming analysis in order to form a comprehensive picture of the customer’s profile. At the same time, today’s rapid methods of engagement have conditioned customers to expect immediate response times.
Through analysis of historical activity relative to available staff, managers can more accurately predict the actual staffing needs, reducing the number of floater agents used as a safeguard. Risk management, client response times, and operational costs all play a role in your customer servicelevels. Until next time.
Through careful demographic analysis, you can foster long-lasting customer relationships based on trust and reliability. Streamline Communication Channels Efficient communication channels facilitate swift and effective customer service. It should be the entire company, says Tony Hsieh , Former CEO of Zappos.
Call Center Reporting and Data Analysis. With voice-powered technology taking care of reporting and data analysis, agents are free to focus on what any customer service employee will tell you is the most important task: assisting the consumer. Customer Self-Service and Phone Call Automation. It’s a win-win.
Forecasts are never 100%, but real-time call center data analysis helps fill the gaps. Plan for too few and servicelevels degrade as agents become overwhelmed. This is where real-time data analysis and intraday shift management come into play. These are essential tasks. The contact center has no choice but to adapt.
Technology leads – Technology leads (including product and application owners) must be aware of financial requirements (for example, budget constraints) as well as business requirements (for example, servicelevel agreements). Tagging at the servicelevel allows for more granular monitoring and control of your cost.
s issue is dealt with in a timely manner (very similar to the longest wait time in a queue versus servicelevel and ASA). A detail analysis of call handling for each call type would reveal those barriers and potentially an entirely non FCR call type. FCR Ceiling (Upper Limit). Every organization attempts to simplify its?
Regular analysis of CSAT data identifies trends and areas for improvement in agent performance and overall service delivery. Regular NPS surveys and analysis help identify promoters, passives, and detractors, allowing for targeted improvements in service delivery.
Collector-owned accounts maintain the continuity of the customer relationship and personalized service, and account familiarity helps increase customer satisfaction and can improve payment performance. SPEECH ANALYTICS with Data Mining, Analysis & Evaluations. It can also be used to create transcripts of calls for further analysis.
Management must find ways to cost-effectively onboard contractors and optimize initial processes — often remotely — in order to ensure consistent servicelevels. Automating these processes using visual analysis tools or “smart eyes” can be a game-changer, thanks to Computer Vision AI.
From essentials like average handle time to broader metrics such as call center servicelevels , there are dozens of metrics that call center leaders and QA teams must stay on top of, and they all provide visibility into some aspect of performance. Was it an agent error or a technical error?
In the new normal without visual cues, a robust workforce management system must enable a simple but insightful analysis of historical adherence and productivity events. . Workforce planners are reassessing target servicelevels, acceptable average handle times and adherence tolerances.
In the last decade, there has been an influx of customer experience platforms that all offer the ability to capture data and give actionable insights to deliver exceptional customer service. Examples include interviews, focus groups, conversational analysis, and ethnography.
An efficient workflow also empowers law firms to manage a volume of cases, potentially boosting revenue while upholding exceptional servicelevels, leading to boosted customer satisfaction. Clients are provided with updates that boost trust and contentment.
An independent analysis of Interactions IVA against competitors shows that while simple transactions yield similar success rates (90-100%), as transactions grow more complexoften exceeding eight utterancesInteractions demonstrates a 400% higher rate of successful automation.
Then set up a way to conduct quality analysis on those interactions to ensure you are delivering on your committed customer expectations. It wasn’t very revealing of agents’ real performance — or of any customer service problems that might be brewing. 93%) Personalizing the customer service they offer them. (90%)
Why it matters: Consistent adherence ensures adequate staffing levels, minimizing wait times and maintaining servicelevel agreements. ServiceLevel: This metric measures the percentage of calls answered within a specified timeframe.
Sentiment analysis AI analyzes customer text or speech to gauge emotion and tone, categorizing interactions as positive, neutral, or negative. Customer service automation enables organizations to scale instantly without increasing headcount. They use machine learning to refine and prioritize answers based on relevance.
Really, it’s a promise, one you must keep in order to satisfy clients and maintain the servicelevels that will keep your long-lasting relationship with them buoyed. Anyone working in the service industry, be it in retail, health or finance, should get the low-down on ServiceLevel Agreements (SLAs), and fast.
I don’t mean that they don’t know that your servicelevel goal is 80/20, but they don’t know WHY the goal is set to that. The WFM team might be responsible for meeting an 80/20 servicelevel, but there is no background as to why that number was chosen and how they should be expected to meet it.
It’s because we tend to look at occupancy across much broader time periods–heck, for the day it was only 73%–and we tend to track intervals based on whether we made or lost servicelevel. Run this analysis in your center and I suspect you will have an “ah ha” moment. Many centers don’t employ agent profiles.
In fact, I often get copied on emails requesting a detailed schedule analysis or staffing projection, and after a momentary panic attack, realize one of the other Jeremys was the intended recipient. Servicelevel goal – This is the percentage of customer interactions we want to handle or respond to in X number of minutes or hours.
An analysis like this will let you see bigger trends, such as an increase in the number of requests on a particular issue or an increase in response time, that you may not identify by simply looking at daily metrics. Get ahead of the trends by setting alerts for questions like: “I want to speak to a manager!”.
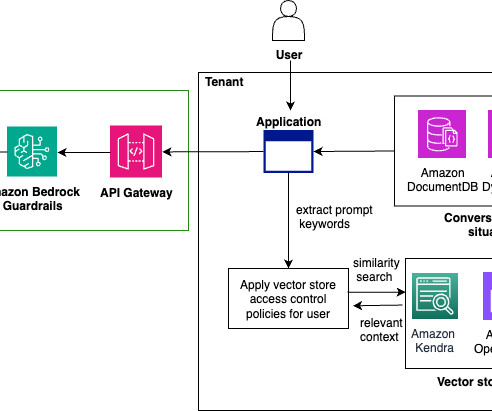
Tenant billing and subscription management – In solutions with different pricing models or subscription plans, the tenant management component can handle billing and subscription management for each tenant based on their usage, resource consumption, or contracted servicelevels. The invocation generates an AWS CloudTrail event.
More than likely, if they are not using a Business Intelligence tool for their data analysis, then they are using Excel. Based on some of the discussions we have had with our customers regarding their reporting challenges, one of the challenges they often cite is how time intensive it is to create the analysis they need in Excel.
We organize all of the trending information in your field so you don't have to. Join 34,000+ users and stay up to date on the latest articles your peers are reading.
You know about us, now we want to get to know you!
Let's personalize your content
Let's get even more personalized
We recognize your account from another site in our network, please click 'Send Email' below to continue with verifying your account and setting a password.


Let's personalize your content