This site uses cookies to improve your experience. To help us insure we adhere to various privacy regulations, please select your country/region of residence. If you do not select a country, we will assume you are from the United States. Select your Cookie Settings or view our Privacy Policy and Terms of Use.
Cookie Settings
Cookies and similar technologies are used on this website for proper function of the website, for tracking performance analytics and for marketing purposes. We and some of our third-party providers may use cookie data for various purposes. Please review the cookie settings below and choose your preference.
Used for the proper function of the website
Used for monitoring website traffic and interactions
Cookie Settings
Cookies and similar technologies are used on this website for proper function of the website, for tracking performance analytics and for marketing purposes. We and some of our third-party providers may use cookie data for various purposes. Please review the cookie settings below and choose your preference.
Strictly Necessary: Used for the proper function of the website
Performance/Analytics: Used for monitoring website traffic and interactions
Read Time: 12 minutes Table of Contents Introduction Looking to understand and use contact center analytics to boost efficiency and build customer loyalty? Key takeaways Understanding contact center analytics : Contact center analytics collect consumer data to help you review customer interactions and make informed business decisions.
With the advancement of the contact center industry, benchmarks continue to shift and challenge businesses to meet higher customer expectations while maintaining efficiency. Whether you’re measuring agent performance or overall customer satisfaction, staying aligned with modern standards is key to success.
First Response Time (FRT) makes this critical caller waiting period clear enough to act on, ensuring you can positively impact the customer journey and experience at the very first touchpoint. For more information on the customer experience, download our white paper, The CX Pro’s Guide to Speech Analytics. CustomerEffort Score.
CustomerEffort Score (CES) measures how hard it is for your customers to get help from your customer service teams. Thats where CustomerEffort Score (CES) comes in. You can use it to gauge which processes are frustrating for customers and how to remove that friction. Has this ever happened to you?
Much of the marketing world is still focused on customer acquisition, but to improve customer retention will yield f ar better ROI and cost about 5-25X less than customer acquisition. What is Customer Retention? Hand-picked related content: How to reduce churn using customer journey analytics ].
Companies are increasingly benefiting from customer journey analytics across marketing and customer experience, as the results are real, immediate and have a lasting effect. Learning how to choose the best customer journey analytics platform is just the start. Steps to Implement Customer Journey Analytics.
Power’s leading industry intelligence, data, and benchmarks with the voice of customer insights delivered from Tethr to help organizations explore and pinpoint the specific areas needing attention to improve customer experience. Michael Vermillion, Vice President and General Manager, Customer Service Practice at J.D.
Successful voice of customer programs set up a system for ongoing monitoring and analysis of their needs and sentiments. It helps your team deal with concerns quickly, consistently increasing overall customer satisfaction. Your customer data becomes accessible in real-time by everyonefrom leaders to the frontlines.
Monitoring trends in NPS helps you pinpoint areas that need improvement to better meet (or exceed) customer expectations. Some companies, like those highlighted in Qualtrics’ NPS Guide , use NPS not only for insights but also for benchmarking. It’s all thanks to AI and NLP. Measuring satisfaction during live interactions.
Best For Organizations of any size that want expert-built surveys, top-tier analytics, and full access to premium platforms without paying for or managing the tools themselves. It offers custom question types, logic, and multilingual support, though its analytics are more basic compared to Qualtrics.
Setting survey response rate benchmarks can help you assess the performance and overall growth of your customer experience management (CEM) system. While benchmarking is a common process in many companies, the exact steps and data collected need to be adjusted to each organization’s requirements.
Does your website offer self-service to resolve issues with minimal customereffort and integrate humans when it makes sense? When customers need support beyond web self-service, do you guide them to the best channel (such as chat or telephone based on their reason for contacting you)? Wed, 04/25/2018 - 09:55.
Leverage advanced forecasting and scheduling tools Meeting customer demand with optimal efficiency is both art and science. Leverage machine learning and analytics to predict call volume, anticipate changes, and then optimize schedules to minimize wait times and maximize resource utilization.
At Outsource Consultants, we have identified four key metrics that provide a comprehensive assessment of customer experience: Net Promoter Score (NPS) , Customer Satisfaction Score (CSAT) , CustomerEffort Score (CES) , and First Contact Resolution (FCR). Use AI-driven analytics to identify bottlenecks.
When you think about your own customer relationship goals today, instead of showering them occasionally with grand gestures, chocolates, flowers, dinner, and spa gift cards – consider treating them to a consistently great customer experience (CX) all year long. of respondents rate their analytics capabilities as optimal.
The customer retention rate (CRR) is a great indicator of your business’s health and profitability. The higher the CRR, the more money you can invest in customer acquisition. However, for each industry, there are benchmarks to show the normal CRR. Nicereply is a tool that will help you gather feedback from your customers.
By Steve Offsey CX leaders use a myriad of metrics like Net Promoter Score ® (NPS ® ), Customer Satisfaction and CustomerEffort Score. Not all companies measure and prioritize it, yet the importance of customer lifetime value (CLV) is staggering. Maximizing revenue and profit margins in the long-term starts here.
Key findings: Reducing customereffort ranks as the #1 customer experience priority for the coming year. That makes sense, but the term “customereffort” is so nebulous, it’s hard to extract much meaning from this data point. Our favorite chart: Customer Service Index Report. Who wrote it: Five9.
It would be ideal if you already know your customers’ digital behaviors. For example, how often do they access a particular service (Google Analytics), or how much do they purchase (CRM), etc. There are many different metrics to choose from, such as CSAT, NPS, and CustomerEffort Score. Attitudinal questions.
CustomerEffort Score (CES): CES measures the level of effort a customer perceives they had to exert to resolve their issue. This metric helps identify friction points in the customer journey and highlights areas where agents can streamline processes. Acknowledging and reward outstanding performance.
Key features of Survicate are: Option to select templates like customer satisfaction (CSAT) survey, customereffort score (CES) survey, product-market fit survey, user experience survey, and so on. Easy integration with third-party applications like Hubspot, Zapier, Google Analytics, and more. Pricing: Custom Pricing.
This goes on to show that customer service is increasingly becoming one of the deciding factors for people to invest in a business. In short, customer service cannot be neglected anymore. It has also become a benchmark that can impact your brand image and, if not done right, can easily hamper your marketing efforts at the same time.
By Swati Sahai Companies are increasingly benefiting from customer journey analytics across marketing and customer experience, as the results are real, immediate and have a lasting effect. Learning how to choose the best customer journey analytics platform is just the start. If so, you are not alone.
And how can you turn customereffort into effortless customer loyalty in every interaction? We’ll teach you that and more in “The Anatomy of an effortless service customer interaction.” ” THE BIG TAKEAWAYS: One customer interaction can undermine an entire customer experience.
These factors collectively form the foundation on which your customer satisfaction scores are awarded. Humans are highly analytical and demanding species. Calculating Customer Satisfaction. There is no definite benchmark method to measure customer satisfaction scores. CustomerEffort Score (CES).
As a rule, I would always suggest collecting NPS as one of a number of metrics (including CSAT and CustomerEffort) unless there is a compelling reason why you should not. I would NEVER rely on NPS as the only measurement of customer perception." Sue Duris Customer Experience and Digital Marketing Consultant.
But while the idea of using a speech analytics solution to tap into customer voice for CX insights sounds great, there are some serious flaws to this approach that the vendors probably won’t tell you about. No more extreme response or recall bias to contend with.
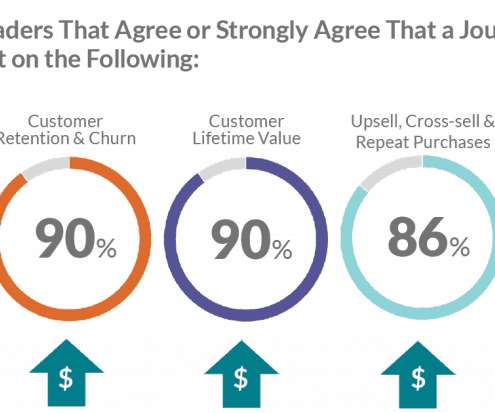
Most customer support analytics will fall under the following categories: Speed Metrics 90% of customers appreciate an “immediate” response after a customer service or support query. Try to clock an FRT that’s less than three minutes , which is the industry benchmark. Well, we’ve got you covered.
Choosing the right agent performance metrics can be crucial for your call center Its also essential to differentiate between customer-focused metrics and agent-focused metrics. First Call Resolution (FCR) FCR is a cornerstone of call center performance metrics, measuring how many customer issues are resolved on the first attempt.
Its also essential to differentiate between customer-focused metrics and agent-focused metrics. Customer-focused metrics, such as CSAT, net promoter score, and customereffort scores, measure satisfaction and loyalty by assessing how well your contact center meets customer expectations.
In this post, we’ll walk through all the basics of customer feedback analysis, from prepping your customer data to using survey analytics tools to simplify the process. Analyzing customer feedback. Conducting survey analytics can be complicated. Feedback dashboard analytics. Survey reports.
Companies receive real time feedback in massive volumes, if they only start listening to their customers. Insightful analytics is possible with the modern technologies such as machine-learning-based text analytics. Don’t just trust what the industry benchmarks say but test the linkage yourself with your own data.
Companies receive real-time feedback in massive volumes if they only start listening to their customers. Insightful analytics is possible with modern technologies such as Lumoa that have machine-learning-based text analytics. Don’t just trust what the industry benchmarks say but test the linkage yourself with your own data.
Understand any analytical dashboard features, automated reporting, voice analytics, and online portal access. Does your contact center focus on an enhanced knowledge base, reduction in agent frustration, digital channel utilization, improved first contact resolution, and reduced customerefforts? Free your Phone!
Factors like customer satisfaction, new customer acquisition, contact center financials, customereffort scores, and agent attrition are just a starting point for measuring and monitoring. If you are going to measure performance over time and progress against goals, you’ll need to set benchmarks and have concrete data.
Look at your customer journey created in step 1, identify which channels your customers prefer, and then review the NICE inContact CX Transformation Benchmark (<link to infographic?>) >) to understand which of those channels tend to drive the most satisfaction and highest NPS.
Key findings: Reducing customereffort ranks as the #1 customer experience priority for the coming year. That makes sense, but the term “customereffort” is so nebulous, it’s hard to extract much meaning from this data point. Our favorite chart: Customer Service Index Report. Who wrote it: Five9.
Customer satisfaction is at the core of the human-to-brand experience, but is notoriously difficult to measure since it is an emotion. Further reading and resources: The benefits and importance of customer satisfaction. Let’s start with customeranalytics. Further reading and resources: What Is Customer Intelligence?
SoGoSurvey is a comprehensive survey tool that helps you collect feedback from both your customers and employees. With versatile question types and in-depth analytics mechanisms, you can come out with a complete strategy to close your feedback loop. Easily integrate with 3rd party tools like google analytics, slack, and so on.
Focus on customer experience Businesses have moved beyond competing on price and product and are now trying to differentiate themselves based on the experiences they provide. Engage agents The saying “happy agents make happy customers” may be overused, but that doesn’t mean it’s not 100% true.
Customers respond using a 0-10 rating scale, with responses grouped into three categories: Promoters (9-10) Passives (7-8) Detractors (0-6) (Read more about NPS: How to Calculate NPS Using Journey Analytics ) CustomerEffort Score (CES) Like NPS, customereffort score (CES) uses a single question to gauge customer satisfaction.
Among them is the Net Promoter Score, (NPS) the overall customer satisfaction score, (CSAT) the CustomerEffort Score (CES). Other considerations are rating scales, sampling effects, international scoring and weighting, the use of rolling averages, benchmarks, and benchmarking studies. Data Analysis.
Customer Relationship Management (CRM), live chat, and customer support platforms help your sales and support teams directly communicate with customers and keep track of direct engagements. Customeranalytics allows you to track and report on how customers actually use your service.
We organize all of the trending information in your field so you don't have to. Join 34,000+ users and stay up to date on the latest articles your peers are reading.
You know about us, now we want to get to know you!
Let's personalize your content
Let's get even more personalized
We recognize your account from another site in our network, please click 'Send Email' below to continue with verifying your account and setting a password.


Let's personalize your content