This site uses cookies to improve your experience. To help us insure we adhere to various privacy regulations, please select your country/region of residence. If you do not select a country, we will assume you are from the United States. Select your Cookie Settings or view our Privacy Policy and Terms of Use.
Cookie Settings
Cookies and similar technologies are used on this website for proper function of the website, for tracking performance analytics and for marketing purposes. We and some of our third-party providers may use cookie data for various purposes. Please review the cookie settings below and choose your preference.
Used for the proper function of the website
Used for monitoring website traffic and interactions
Cookie Settings
Cookies and similar technologies are used on this website for proper function of the website, for tracking performance analytics and for marketing purposes. We and some of our third-party providers may use cookie data for various purposes. Please review the cookie settings below and choose your preference.
Strictly Necessary: Used for the proper function of the website
Performance/Analytics: Used for monitoring website traffic and interactions
At the heart of most technological optimizations implemented within a successful call center are fine-tuned metrics. Keeping tabs on the right metrics can make consistent improvement notably simpler over the long term. However, not all metrics make sense for a growing call center to monitor. Peak Hour Traffic.
As the workplace becomes more data-driven, advanced analytics is emerging as a key tool in understanding and improving agent retention. In this blog post, we’ll explore how companies can leverage analytics to not only reduce agent attrition but also foster a more engaged, successful workforce. This is where data comes in.
Fortunately, contact centers can make full use of analytics and smart routing capabilities to maximize inbound call capabilities. Leverage Analytics to Track, Adapt, and Succeed The analytics coming from call centers present the necessary data that enables firms to interpret their performance and customer behavior.
At last month’s LISTEN event, we were excited to award three customers with LISTEN Awards for their achievements in speech analytics success. The LISTEN awards were presented to customer engagement analytics users whose efforts had a direct impact on improving business results for their companies.
A recent Calabrio research study of more than 1,000 C-Suite executives has revealed leaders are missing a key data stream – voice of the customer data. Download the report to learn how executives can find and use VoC data to make more informed business decisions.
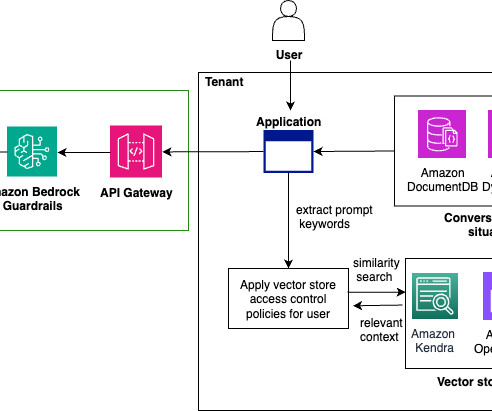
Building generative AI applications presents significant challenges for organizations: they require specialized ML expertise, complex infrastructure management, and careful orchestration of multiple services. This will provision the backend infrastructure and services that the sales analytics application will rely on.
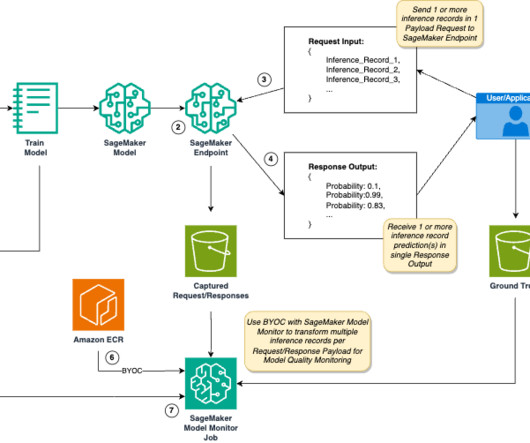
In this post, we present a framework to customize the use of Amazon SageMaker Model Monitor for handling multi-payload inference requests for near real-time inference scenarios. A preprocessor script is a capability of SageMaker Model Monitor to preprocess SageMaker endpoint data capture before creating metrics for model quality.
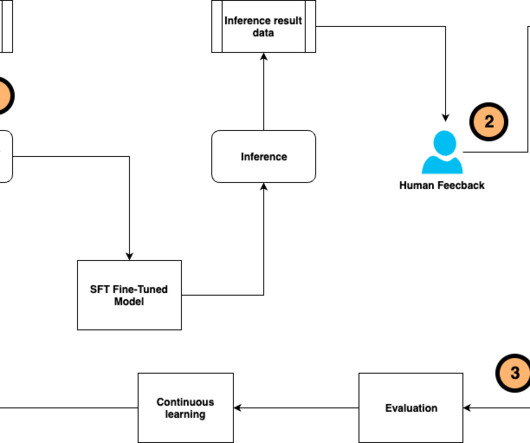
To address these challenges, we present an innovative continuous self-instruct fine-tuning framework that streamlines the LLM fine-tuning process of training data generation and annotation, model training and evaluation, human feedback collection, and alignment with human preference.
In response to valuable feedback from our own customers, we’ve introduced a rich suite of customer experience analytics into our platform, analytics that capture customer experience data points from across your product documentation and self-service support knowledge. What is MindTouch Customer Experience Analytics?
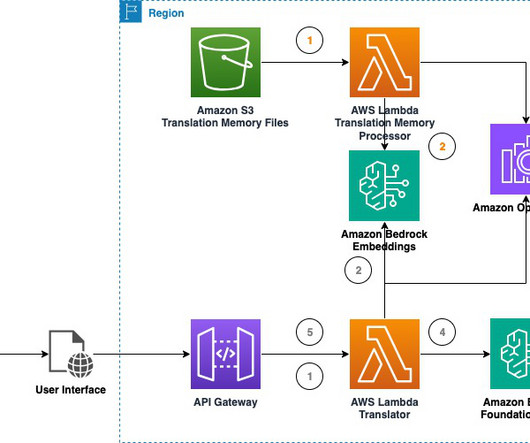
This blog post with accompanying code presents a solution to experiment with real-time machine translation using foundation models (FMs) available in Amazon Bedrock. Also note the completion metrics on the left pane, displaying latency, input/output tokens, and quality scores.
Numerous disparate systems generate perpetual flows of valuable data — the analytic raw material that can yield truth and intelligence about your people, performance, processes, culture and more. Once in place, establish a data management and analytics assessment program to identify data challenges and coordinate and prioritize projects.
The information exists in various formats such as Word documents, ASPX pages, PDFs, Excel spreadsheets, and PowerPoint presentations that were previously difficult to systematically search and analyze. Model monitoring of key NLP metrics was incorporated and controls were implemented to prevent unsafe, unethical, or off-topic responses.
More modern contact centers effectively do the same while incorporating a few key differences to better harness emerging options in communication and analytics. Contact Centers Incorporate Advanced Analytics. Call centers came first, focusing employees on handling large streams of customer calls at once. that can be automated.
This is where organizing your contact center metrics into custom reports comes into play. The Executive Guide to Improving 6 Call Center Metrics. We’ve all suffered through dry presentations featuring data that is hard to tie to everyday actions and goals. The difference between reporting and analytics.
This post presents a solution where you can upload a recording of your meeting (a feature available in most modern digital communication services such as Amazon Chime ) to a centralized video insights and summarization engine. All of this data is centralized and can be used to improve metrics in scenarios such as sales or call centers.
As metrics pile up, you may find yourself wondering which data points matter and in what ways they relate to your business’s interests. Visualizations turn raw metrics into stories that can be shared and acted upon. Differentiate between presentation and exploratory graphics. Revealing Flaws, Fraud and Anomalies.
Telephony was still largely analog and call recording capabilities were limited, so there wasn’t much in the way of metrics. KPIs and metrics became more sophisticated, and existing reporting tools provided good visibility into daily operations. If that’s you, then next week’s webinar will be time well-spent.
Metrics, Measure, and Monitor – Make sure your metrics and associated goals are clear and concise while aligning with efficiency and effectiveness. Make each metric public and ensure everyone knows why that metric is measured. Jeff Greenfield is the co-founder and chief operating officer of C3 Metrics.
These sessions, featuring Amazon Q Business , Amazon Q Developer , Amazon Q in QuickSight , and Amazon Q Connect , span the AI/ML, DevOps and Developer Productivity, Analytics, and Business Applications topics. Hear from Availity on how 1.5 In this session, learn best practices for effectively adopting generative AI in your organization.
But to enjoy those data, you need to know how to analyze them, and that’s why marketing analytics courses can help you. Best Marketing Analytics Courses 1. Marketing Analytics With the Marketing Analytics course, you will learn the most important marketing metrics and how to apply them to your data.
Collaborative, analytical, and team-focused, it works because it focuses on preventable churn, and keeps blame to a minimum. The main components of this include: The Concept: Opportunity for CSMs to learn and grow by engaging in a structured churn reflection activity and presenting their findings. Does it work?
This post focuses on evaluating and interpreting metrics using FMEval for question answering in a generative AI application. FMEval is a comprehensive evaluation suite from Amazon SageMaker Clarify , providing standardized implementations of metrics to assess quality and responsibility. Question Answer Fact Who is Andrew R.
Paul is a Transformational, hands-on, customer service department leader with extensive experience using performance metrics, lean process improvements, and positive leadership in building effective, efficient, and happy customer service departments. He has 30 years of experience in inbound, outbound, chat, analytics, AI, and social media.
Many are actively collecting Voice of Customer (VOC) data through surveys, feedback management, analytics and market research relating to customer retention, loyalty, brand equity and satisfaction. Today, businesses are able to measure their activities, impact of customer experiences, and customer relationship with unprecedented precision.
Contact Center Leaders are continually being pushed to improve processes, decrease cost, increase customer satisfaction, and improve sales or metrics. They have experience across many centers and industries and can either present quick solutions or listen to your ideas and provide feedback on what you might expect.
This article delves into how to evaluate call center agent performance effectively, outlining key call center agent metrics and exploring innovative new techniquesas well as too-often-overlooked onesto elevate your team’s success. This means, first, they must be able to track the right agent performance metrics.
Model monitoring – The model monitoring service allows tenants to evaluate model performance against predefined metrics. A model monitoring solution gathers request and response data, runs evaluation jobs to calculate performance metrics against preset baselines, saves the outputs, and sends an alert in case of issues.
After all, workplace training has a reputation for being dull with endless PowerPoint presentations and the occasional role-playing exercise. Ask yourself: Is the information presented in a way that will appeal to our agents? Share analytics with your agents. Involve your employees in data collection and analytics.
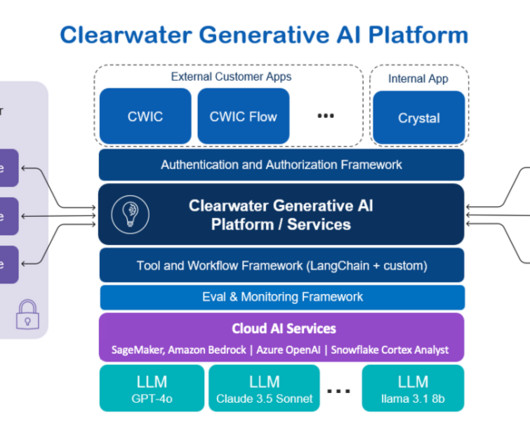
This post was written with Darrel Cherry, Dan Siddall, and Rany ElHousieny of Clearwater Analytics. About Clearwater Analytics Clearwater Analytics (NYSE: CWAN) stands at the forefront of investment management technology. This approach enhances cost-effectiveness and performance to promote high-quality interactions.
To build and maintain a successful knowledge base for your call center, youll want to curate high-quality content and present it in an intuitive interface. The search function uses a sophisticated algorithm to present the most relevant results, enabling faster, more informed resolutions. What is a knowledge management system?
When on the phone with a customer, agents are responsible for juggling the incoming information that a customer provides while processing data presented on the screen in front of them. In addition, speech analytics software can help managers understand and measure their agents’ empathy.
Call Center Monitoring: All call analytics which can be tracked and measured are in call center monitoring software. The most sophisticated solutions offer multi-channel text and speech analytics. Call Analytics: Essentially, speech analytics tools track metrics to enable reps and managers to evaluate the success of call campaigns.
Most managers also rely on an analytics package (or several, depending on how integrated your software is) to monitor KPIs. Access to next-level analytics . AI is Providing Next-Level Analytics . Analytics are the backbone of tracking efficiencies in the contact center. But suddenly, there’s so much more.
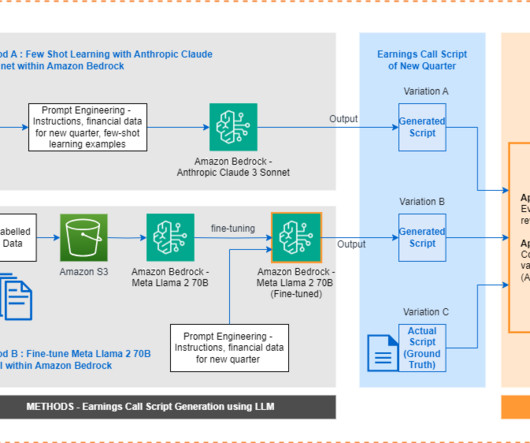
Earnings calls are live conferences where executives present an overview of results, discuss achievements and challenges, and provide guidance for upcoming periods. Draft a comprehensive earnings call script that covers the key financial metrics, business highlights, and future outlook for the given quarter.
A comprehensive needs assessment involves: Analyzing Performance Data: Dive into key metrics like Customer Satisfaction (CSAT) , First Call Resolution (FCR) , Average Handle Time (AHT) , and other factors of QA scorecards. Ask: Where are the gaps in performance? Are there common trends indicating specific skill deficiencies?
Predictive Analytics and Proactive Service: Analyzing VoC data historically allows businesses to forecast demand, predict trends, and ensure agents are prepared to handle customer inquiries during peak seasons, improving overall support efficiency. First, capture these metrics at their baseline. Look at your data to predict trends.
TTEC Digital has been instrumental in enabling us to achieve our vision of having a unified, consistent way of presenting the right opportunities, data, and leads to our people on a global basis.” “Westcon-Comstor recognizes the important role that a consistently excellent sales process plays within the customer experience. .
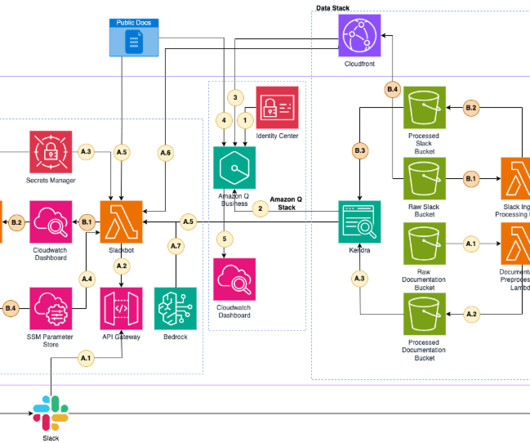
The result is a cohesive, cost-efficient system that maintains uniformity in information retrieval and presentation, regardless of the users chosen interface. Monitoring Amazon Q has a built-in feature for an analytics dashboard that provides insights into user engagement within a specific Amazon Q Business application environment.
At ZERO-IN 2024, Higher Locic ‘s Heather Wendt gave an excellent presentation on the steps of building a community and amplifying its networking effects and business impact. This intermediate stage offers offers affordable solutions with limited analytical capabilities. 2: Align community metrics with organizational goals.
Far too many companies blindly track dozens of customer service metrics or KPIs without having a clear pathway to actioning them or understanding which metrics can truly move the needle for their customer satisfaction and bottom line. Otherwise, your data can become muddied and will present a lopsided story.
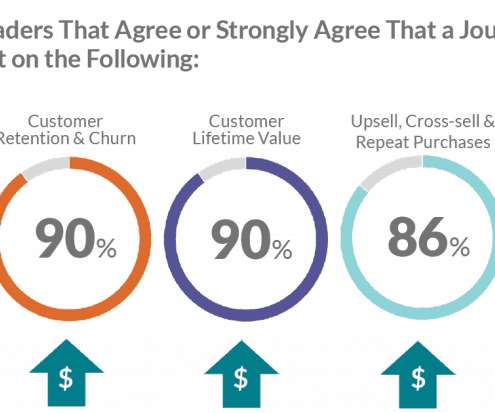
By Steve Offsey CX leaders use a myriad of metrics like Net Promoter Score ® (NPS ® ), Customer Satisfaction and Customer Effort Score. Customer insights leaders increasingly recognize the importance of calculating a more customer-focused metric like CLV and infusing it throughout their businesses.
As industrial and economic globalization trends continue to develop in the world’s present market, the use of outsourced talent to accomplish a wide variety of tasks ranging from the rote and repeatable to the complex and mission-critical grows ever more ubiquitous. Better Agent Performance. Sales Pursuits.
We begin by understanding the feature columns, presented in the following table. After a successful import, you will be presented with a preview of the data, which you can browse. For Objective metric , leave as the default F1. F1 averages two important metrics: precision and recall. For Analysis name , enter a name.
Over the years, the customer satisfaction score has emerged as a promising metric. In the initial stage, the customers are presented with a close-ended question- “ How was your experience of interacting with our sales/customer support department ?” Meaningful Reports & Analytics.
We organize all of the trending information in your field so you don't have to. Join 34,000+ users and stay up to date on the latest articles your peers are reading.
You know about us, now we want to get to know you!
Let's personalize your content
Let's get even more personalized
We recognize your account from another site in our network, please click 'Send Email' below to continue with verifying your account and setting a password.


Let's personalize your content