This site uses cookies to improve your experience. To help us insure we adhere to various privacy regulations, please select your country/region of residence. If you do not select a country, we will assume you are from the United States. Select your Cookie Settings or view our Privacy Policy and Terms of Use.
Cookie Settings
Cookies and similar technologies are used on this website for proper function of the website, for tracking performance analytics and for marketing purposes. We and some of our third-party providers may use cookie data for various purposes. Please review the cookie settings below and choose your preference.
Used for the proper function of the website
Used for monitoring website traffic and interactions
Cookie Settings
Cookies and similar technologies are used on this website for proper function of the website, for tracking performance analytics and for marketing purposes. We and some of our third-party providers may use cookie data for various purposes. Please review the cookie settings below and choose your preference.
Strictly Necessary: Used for the proper function of the website
Performance/Analytics: Used for monitoring website traffic and interactions
This week we feature an article by Kaavya Karthikeyan who writes about customer support metrics that you should be tracking. – Shep Hyken. One of the best ways by which you can ensure your organization is consistently performing is by benchmarking customer support metrics. The industry benchmark for FRR is 7 hours.
For businesses that have become the benchmark for top customer service, what are they doing differently? They also look into tools that can help gather useful analytics and track metrics. The post Guest Blog: The Hidden Workings of Top Customer Support Teams appeared first on Shep Hyken. Consider the following: 1.
This week on our Friends on Friday guest blog post my colleague, Steven Macdonald, shares the results of a study examining how companies around the world respond to customer service requests. That’s why a quick response time is one of the most important metrics for measuring good customer service. I find the results quite alarming!
With the advancement of the contact center industry, benchmarks continue to shift and challenge businesses to meet higher customer expectations while maintaining efficiency. In 2025, achieving the right benchmarks means understanding the metrics that matter, tracking them effectively, and striving for continuous improvement.
Explore key customer service stats and benchmarks for 2025. The post 35 Customer Service Industry Statistics & Benchmarks You Need to Know appeared first on AnswerConnect Blog. Enhance your service with insights on customer satisfaction, tech trends, and market growth.
As has been widely noted in today’s marketplace, your customers’ opinions and expectations – for good or bad, reasonable or not – are your company’s new benchmark. The reasons are obvious: surveys help your business understand the emotional and psychological factors that drive customer behavior and affect your metrics.
A new list of benchmarks is published each year by ACSI, with minor quarterly updates. . Below is the complete list of the newest CSAT benchmarks. Click here to download the current industry benchmarks. And if you want to see quarterly benchmark updates, just visit their website. . Customer Satisfaction Score is 76.5%.
It has become a standard metric used to determine if your Customer Service and Experience improvements are effective. In their 15th annual Net Promoter Benchmark Study, he gave a great presentation of some really interesting stats on NPS. the higher the score, the greater the likelihood they will recommend).
Understanding how to make a profit on the double bottom line (DBL) involves employing a broad range of KPIs and key metrics to ensure a contact centre meets every need that a business may have in supporting their customers. of the 380 contact centre professionals they asked thought customer satisfaction was one of the most important metrics.
However, the silver lining in the gloomy cloud, as Thompson puts it, is that these companies do see improvement in metrics like customer satisfaction ratings, increased revenue, lower costs, and more employee engagement than in the past. The metrics you choose should line up with your actions and the goals you are trying to meet.
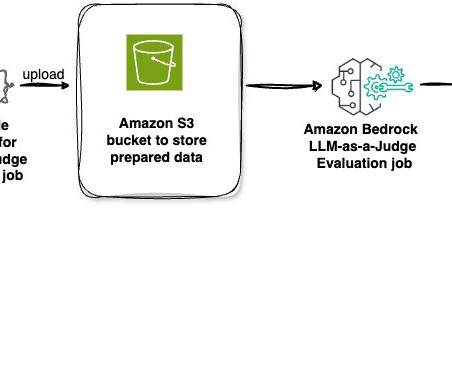
This approach allows organizations to assess their AI models effectiveness using pre-defined metrics, making sure that the technology aligns with their specific needs and objectives. referenceResponse (used for specific metrics with ground truth) : This key contains the ground truth or correct response.
Why is benchmarking important? This is where benchmarking is helpful. This is where industry benchmarks come in. Check out the following benchmarks to see how you compare in CSAT, NPS, and CES, and inspire your own goal setting. CSAT Benchmarks. NPS Benchmarks. How do we compare to our competitors?
Still getting to grips with call center metrics and which ones are the most important? This blog will teach you what FCR is, the difference between First Call Resolution and First Contact Resolution, and everything about FCR that you need to know to succeed in a contact center. Contact Center Trends 2021. first appeared on Fonolo.
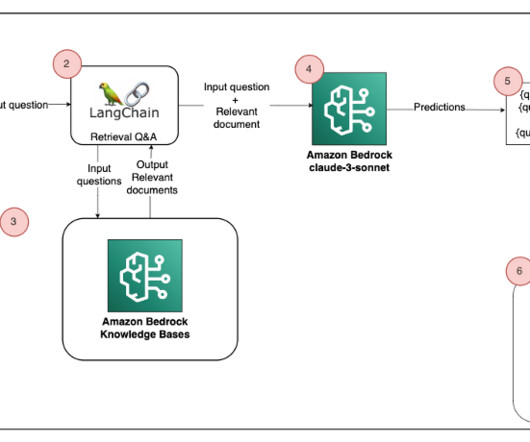
This blog post delves into how these innovative tools synergize to elevate the performance of your AI applications, ensuring they not only meet but exceed the exacting standards of enterprise-level deployments. More sophisticated metrics are needed to evaluate factual alignment and accuracy.
Whenever focus shifts to financial metrics, CX professionals at every level can fall into heightened levels of expectation. When we start to chase metrics, there can be a temptation to influence those metrics by any means possible. Back to CX Accelerator Blog. Be transparent about your change initiatives.
High-level management love metrics. I have always had my issues with NPS, which is a metric that gives a score to organizations based on responses to the question “How likely are you to recommend us to friends and family?” Bell has a few ideas for this: Prove to senior management it works.
So, in other words, when your customers feel these, you can get blips of improvement in your “value” metrics. If you want to benchmark your organization’s performance in the new world of behavioral economics against other companies, take our short questionnaire.
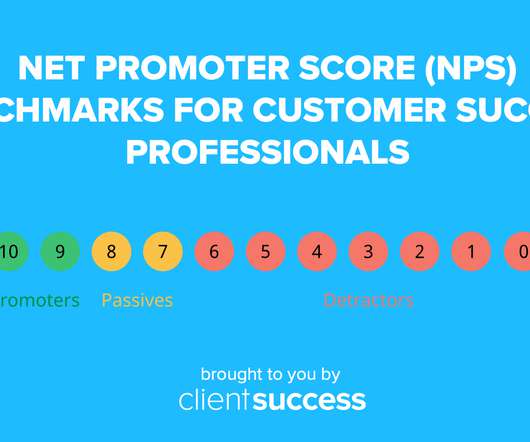
Net Promoter Scores are always an interesting topic of conversation, and industry NPS benchmarks even more so. A Net Promoter Score (NPS) is a metric used to measure customer loyalty and satisfaction. This blog post will discuss NPS benchmarks and look at why NPS is so essential to overall customer success.
To help you on this journey, this blog reveals the key financial services and banking metrics from our 2021 Live Chat Benchmark Report , alongside top live chat best practices that will help you to gain your clients’ trust and loyalty. Wait times are key to any customer service team. Colette Branigan, Affinity Credit Union.
Measuring just a piece of this journey can seem short-sighted or not as powerful as other CX metrics, like Net Promoter Score (NPS). CX shouldn’t ever be measured by one metric alone. Customers and their experiences are complex and nuanced, so there’s no perfect metric. Conclusion on CSAT . Understand your customer expectations.
Metrics, Measure, and Monitor – Make sure your metrics and associated goals are clear and concise while aligning with efficiency and effectiveness. Make each metric public and ensure everyone knows why that metric is measured. Jeff Greenfield is the co-founder and chief operating officer of C3 Metrics.
Whenever focus shifts to financial metrics, CX professionals at every level can fall into heightened levels of expectation. When we start to chase metrics, there can be a temptation to influence those metrics by any means possible. Back to CX Accelerator Blog. Be transparent about your change initiatives.
Call centers handle complaints, help you identify pain points, and standardize the customer experience and you need the right call tracking metrics to understand performance. Set essential call tracking metrics. With call metrics, you have a standard way to evaluate your call center’s performance. What Are Call Tracking Metrics?
Performance metrics analysis: This involves tracking and benchmarking key performance indicators (KPIs) such as customer satisfaction, average handle time, first-call resolution, and call compliance adherence as indicated on QA scorecards and dashboards.
One key metric that helps SaaS businesses gauge their success in these areas is the Customer Effort Score (CES). In this article, we’ll explore the importance of CES in the SaaS industry, how it differs from other customer satisfaction metrics, and why reducing customer effort is crucial for long-term success. .”
Then, you would try to narrow it down by which ones you remember are good/cheap/fast/healthy or whatever other metrics you are using to pick a restaurant. . If you want to benchmark your organization’s performance in the new world of behavioral economics against other companies, take our short questionnaire.
If you know what your performance metrics are, you know how well you’re doing. While there are a lot of different kinds of call center metrics, these 15 KPIs are the most crucial to monitor. Below, you’ll see a list of important call center metrics you need to know about and track. It’s the numerical way to confirm your success.
AI Makes It Possible (Blog Series). Blog #4 of 4 The MORE you know. As noted in the 2019 Dimension Data Customer Experience (CX) Benchmarking report: 88% of contact center decision-makers expect self-service volumes to increase over the next 12 months. Key Learnings from Kate Leggett and Steve Nattress. The more YOU KNOW. .
A: The average response time varies depending on the industry, but a good benchmark is under 20 seconds for inbound calls. Q4: What metrics are used to measure response times? A: Key metrics include Average Handle Time (AHT), First Call Resolution (FCR), and Average Speed of Answer (ASA).
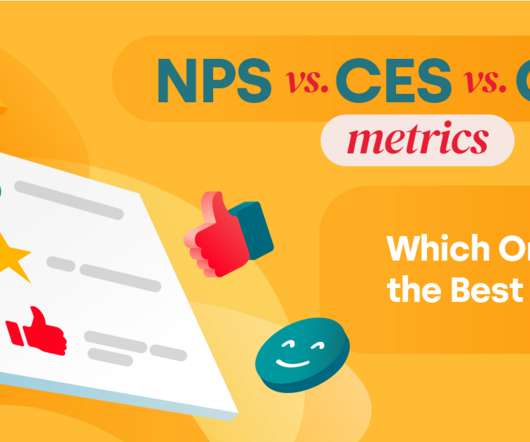
There are so many different CX metrics you could track. That’s exactly what NPS , CES , and CSAT metrics do. In this guide, we’ll explain the difference between these three most common CX metrics so you can make an informed decision on what’s right for your biz. But which one(s) should you actually use?
Call auditing helps ensure that customer interactions meet established quality benchmarks while identifying areas for improvement. In this blog, we will explore the best practices for auditing calls, the importance of quality assurance (QA), and how to maintain high standards through continuous improvement.
This article was originally published on WnTD's blog. Tracking the proper metrics is essential in understanding how your business is performing. For now let’s concentrate on the following four main metrics. This really depends on your industry so you want to familiarize yourself with industry benchmarks.
In this blog post, we show how we optimized torch.compile performance on AWS Graviton3-based EC2 instances, how to use the optimizations to improve inference performance, and the resulting speedups. You can see that for the 45 models we benchmarked, there is a 1.35x latency improvement (geomean for the 45 models).
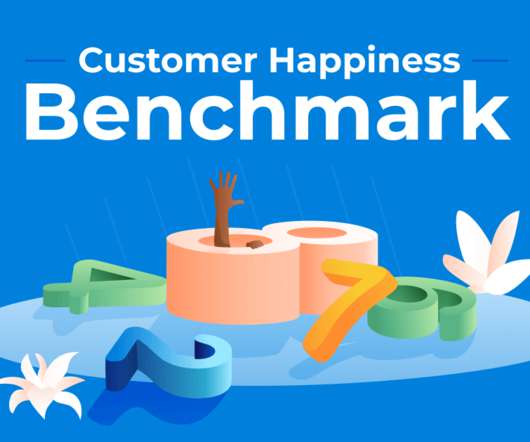
For the last couple of weeks, we’ve been working on a very exciting update – a brand new Customer Happiness Benchmark page. After a general benchmark data, you can see the Leaderboard of the most successful companies with the highest Customer Satisfaction Score. The next leaderboard is about the Net Promoter Score metric.
The question on the table…does the 15-year-old metric of NPS (Net Promoter Score) still have a place on CX dashboards? NPS Pros – There is no better metric for benchmarking data…across industries, historical timelines, and geographic regions.There is still no better metric for the overall Customer Experience.
Both of those metrics are good for examining transactional elements of the customer experience. As we discussed, the best customer experience metric for your business is a matter of finding the best fit for your business. Net promoter scores vary by industry and hence, targets should be set according to benchmarks and norms.
A Net Promoter Score, or NPS, has become a necessary customer experience metric. In fact, an estimated 65% of companies track NPS scores , making it the most coveted customer experience metric measured by companies. I’ll explain how NPS is calculated and give you benchmarks to help determine whether your NPS score is good or bad.
There are so many aspects of support that we measure and benchmark, and articles just like this give tips and tricks on how to improve. Metrics drive our businesses, but who determines those metrics differs from company to company. It’s obvious that your house on fire requires a faster response than your toaster breaking.
It’s no easy task, but the right mix of call center metrics and KPIs can help you stay the course. There are many call center metrics you can measure, but only a few KPIs that you will want to monitor over a period of time. So how can you balance the need for operational efficiency with meeting customer expectations?
Whether you are brand new to the customer success scene or have been a customer success professional for years, one metric of success has been on your radar since day one: Net Promoter Score. Before we get into benchmarks, let’s take a step back and review what NPS entails. NPS benchmarks. So what does your NPS score mean?
The fairly new metric, which turns 21 this year, is widely used across the globe to calculate customer loyalty. In this blog post, we have discussed everything you need to know about Net Promoter Score, starting from its definition, a brief overview, its history, the method to calculate it, and more.
We demonstrate this using an Amazon Comprehend custom classification to build a multi-label custom classification model, and provide guidelines on how to prepare the training dataset and tune the model to meet performance metrics such as accuracy, precision, recall, and F1 score. On the New menu, choose Terminal. for all the labels.
Call metrics and KPIs. Metrics are used to objectively compare and track performance. Call center metrics are both quantitative and qualitative measurements that indicate just how productive your call center agents are and whether they’re offering the kind of customer experience that you’ve trained them to deliver. .
Fortunately, your Net Promoter Score (NPS) is a solid metric to combat the gray area, and understanding it will give you strong insights into your customers’ perception of your business. Average NPS by Industry NPS Leaders by Industry Benchmarking your Net Promoter Score What is a Good NPS Score for SaaS?
We organize all of the trending information in your field so you don't have to. Join 34,000+ users and stay up to date on the latest articles your peers are reading.
You know about us, now we want to get to know you!
Let's personalize your content
Let's get even more personalized
We recognize your account from another site in our network, please click 'Send Email' below to continue with verifying your account and setting a password.


Let's personalize your content