This site uses cookies to improve your experience. To help us insure we adhere to various privacy regulations, please select your country/region of residence. If you do not select a country, we will assume you are from the United States. Select your Cookie Settings or view our Privacy Policy and Terms of Use.
Cookie Settings
Cookies and similar technologies are used on this website for proper function of the website, for tracking performance analytics and for marketing purposes. We and some of our third-party providers may use cookie data for various purposes. Please review the cookie settings below and choose your preference.
Used for the proper function of the website
Used for monitoring website traffic and interactions
Cookie Settings
Cookies and similar technologies are used on this website for proper function of the website, for tracking performance analytics and for marketing purposes. We and some of our third-party providers may use cookie data for various purposes. Please review the cookie settings below and choose your preference.
Strictly Necessary: Used for the proper function of the website
Performance/Analytics: Used for monitoring website traffic and interactions
Surveys are one of the most useful tools out there for gathering quick feedback from customers, and understanding what motivates them. But with great power comes great responsibility – if you’re going to get the results you need to make critical business decisions, it’s important that your survey design is done well!
Creating a consumer perception survey is the first step — here’s everything you need to know so you can find out what customers really think of your brand. What’s the point of your customer perception survey? Before you start creating your customer perception survey, you need to decide its purpose.
Whether check-in meetings, customer feedback surveys , automated workflows, or a bit of everything, ensure that your onboarding process has checkpoints for both accomplishments and review. Group tasks together and apply a percentage with that activity type – for example, what percentage of time do CSMs spend with reporting?
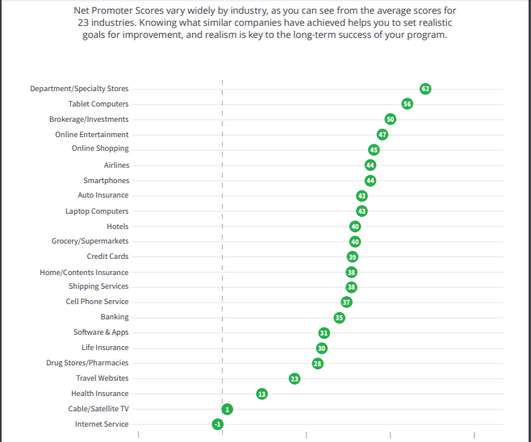
We published a Temkin Group report, Net Promoter Score Benchmark Study, 2018. To compare scores across organizations and industries, Temkin Group measured the NPS of 342 companies across 20 industries based on a survey of 10,000 U.S. consumers.
Check out The Northridge Group’s latest CX research report —the 7th annual CX survey of 1,000 customers and 250 business executives—to see additional statistics as well as insights that businesses can use to benchmark their customer service and improve the overall experience!
In our webinar, 2022 SaaS retention benchmarks , SaaS Capital Manager Director Rob Belcher shares the results from their 11th annual B2B SaaS benchmarkingsurvey. It’s the largest survey of private SaaS companies in the world with over 1,500 responses. It’s a judgment call is the bottom line.
That’s where surveys come in. . Today’s technology makes it easy for businesses to design , create and distribute customer surveys. This post will cover three ways that surveys can be used to help you drum up more leads for your business at different stages of the customer journey. . How to use surveys to engage your audience.
A Comprehensive Guide to Net Promoter Score: History, Calculation Formula, Survey Tips If you are an entrepreneur or a business professional, you probably know what the term ‘Net Promoter Score’ means. It can also be defined as a method to calculate customer experience based on surveys.
SaaS Capital joined us for a webinar to share the results from their 10th annual B2B SaaS benchmarkingsurvey. This survey is the largest survey of private SaaS companies in the world with over 1,500 responses. That’s something that should empower you as you go fundraise to say, “Here’s my peer group.
But heres the problem: too many companies chase a better NPS the wrong waybombarding customers with ineffective surveys and gathering unreliable data. We use scientific rigor, real listening, and reciprocity to design surveys that truly measure and enhance customer satisfaction. At Interaction Metrics, we take a smarter approach.
This core customer service KPI is typically measured through surveys that ask people to rate their agreement with statements like, “The company made it easy for me to handle my issue.” In this sense, CES can almost act as a gauge of how well a company is doing against its benchmarks and those of competitors.
Google reviews, social media activity, and customer service surveys all help companies learn about their customers’ experiences. To calculate NPS scores, you must present your customers with a survey question: “How likely are you to recommend our product or service to a friend or colleague?” Net Promoter scale. Supermarkets – 34.
One of the most common questions we get from our customers is: What type of survey response rate can I expect? When doing some research, you’ll see a wide range of numbers on what a “good” or “average” survey response rate is. What is a survey response rate? What is a good survey response rate?
Customer benchmarking — the practice of identifying where a customer can improve or is already doing well by comparing to other customers – helps Customer Success Managers to deliver unique value to their customers. I’ve found that SaaS vendors use seven distinct strategies to empower CSMs with customer benchmarking.
CAB members—as evidenced by their post-meeting surveys—like to learn and benchmark how their colleagues’ departments are set up, fit within their organizations, resourced and measured by their management. Imagine a meeting with various customers sharing their feedback at a level that is far beyond a traditional focus group.
How can you compare your score to others in your industry, or to any general benchmarks? Below, I’ll walk through some strategies for both external and internal benchmarking, as well as try to convince you that the score itself should be the last thing on your mind. External Benchmarks. Overall Benchmarks.
We just published a Temkin Group data snapshot, Channel Preferences Benchmark, 2018. Here’s the executive summary: In Q3 2017, we surveyed 10,000 U.S. Here are previous benchmarks from 2016, 2015, and Read More. The post Report: Channel Preferences Benchmark, 2018 appeared first on Customer Experience Matters®.
As you can see in the chart below, Temkin Group published a lot of interesting research in 2017. best practice interviews, company surveys, and large-scale consumer studies) to deliver insights about customer experience that shaped the thinking and actions of 1,000s of professionals around the world.
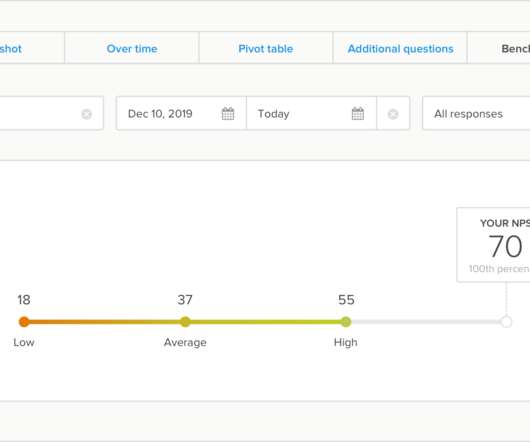
Find out how your real-time NPS compares to competitors in 20 industries with Benchmarks, our newest in-platform report. Prior to this release, our reporting features were all geared towards easy customer experience performance monitoring and feedback analysis for your Delighted survey results. How the Benchmarks report works.
They Avoid Benchmarking: High-performing contact center leaders do not waste a lot of time benchmarking their contact center performance. Years ago, he gave a talk to a group of students in a large auditorium in South Africa. They strive for differentiation. Christine Porath discuss workplace civility ).
A report from Benchmark Portal found that agent satisfaction has remained fairly high. About the Benchmark Portal Agent Voices Report The report is based on a detailed survey that was given to more than 10,000 contact center agents and leads in North America. The survey was conducted in 2020. percent from the 2015 survey.
In the annual Customer Experience Management Benchmark Series (CXMB) 2020 Corporate Edition report, produced by COPC Inc. With next to no warning, 50% of the organizations surveyed had to implement initiatives that hadn’t been in their business plans. SST growth took off. Are you ready to learn more impactful insights?
According to The State of the Customer Experience survey that we did earlier in 2018, all companies track customer experience using one or several of the 6 world-wide recognised KPIs: Net Promoter Score (NPS), Customer Satisfaction (CSAT), Churn rate, Retention rate, Customer Lifetime Value (CLV) or Customer Effort Score (CES).
If you’re new to customer satisfaction surveys and have searched the topic online, then you already know that there’s a trove of information on the subject. So, as your research primer and to help you get up to speed, we created an abbreviated guide that covers three of the most popular survey types: NPS®, CSAT, and CES.
Find out what is a good Net Promoter Score & get out the most of your surveys! Average NPS by Industry NPS Leaders by Industry Benchmarking your Net Promoter Score What is a Good NPS Score for SaaS? Consumer 2023 Net Promoter Benchmarks. Consumer 2023 Net Promoter Benchmarks. Table of Contents What is a NPS Score?
Many companies ask their customers for feedback with email surveys , often after a product has been received or a service has been completed. Ideally, your customers see your request, open the email survey, and provide their feedback. Most important of all is the email survey subject line. Email survey subject line importance.
We just published Temkin Group’s annual Tech Vendor NPS & Loyalty Benchmark Study. To gather this data, we surveyed 800 IT decision-makers from large North American firms about their relationships with their technology Read More.
If managing and distributing a survey isn’t something you want to handle internally, it can easily be outsourced. Check out SQM group , the contact center industry leader for measuring, benchmarking, and improving CX. Understanding Industry Benchmarks. How does it compare? Are you better or worse? Plus So Much More!
We published a Temkin Group report, Net Promoter Score Benchmark Study, 2017. To compare scores across organizations and industries, Temkin Group measured the NPS of almost 300 companies across 20 industries based on a survey of 10,000 U.S.
Voice of the Customer (VoC) surveys are used to analyze the gap between customer expectations and reality. VoC programs incorporate various methods, however, the voice of the customer survey remains the key part among all methods. . But, before moving any further, let’s first understand what a VoC survey is? Retain customers.
Research from The Ascent Group shows that 60% of companies that measure FCR for 1+ year report a 1 to 30% improvement in their performance. Collect customer opinions via social media, surveys, and other methods, and then leverage that feedback to improve policies and refine goals. How to Improve First Call Resolution.
I’ll explain how NPS is calculated and give you benchmarks to help determine whether your NPS score is good or bad. See below an example of an NPS survey created with GetFeedback. . Based on the score, customers are grouped into one of three categories: Detractors, Passives, or Promoters. NPS benchmarks. NPS by industry.
We just published a Temkin Group report, Tech Vendor NPS Benchmark, 2017. We also compared overall results to our benchmarks from the previous five years. To examine this link, we surveyed 800 IT decision-makers from large North American firms, asking about their relationships with their technology providers.
s reputation as a leader in the CXP space, with many years of experience in benchmarking and auditing, meant we had someone who understands our industry and stays abreast of the changing CXP landscape to audit us. s Employee Engagement Services to implement FBC’s first employee survey. Following the surveys, COPC Inc.
Net Promoter Score is primarily obtained through surveys. A typical NPS survey looks like this: The customer is asked to give a rating from a mark of 0 (not at all likely) to 10 ( extremely likely). For easy scheduling and management of recurring surveys, c ompanies are actively using the best net promoter score survey software.
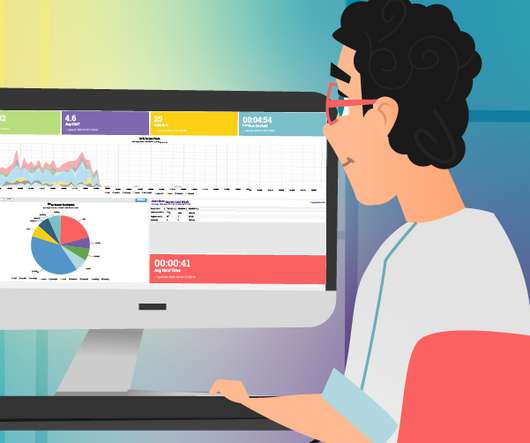
A customized dashboard offers many benefits : Focused insights to improve training and coaching methods Compiled data to improve decision making Transparency to increase agent productivity Clarity around team goals and benchmarks. Send triggered surveys or send them manually and calculate your CSAT score.
The scoring system divides all responders into 3 groups : Promoters (answered 9-10): typically loyal and enthusiastic customers likely to recommend you, Passives (answered 7-8): currently satisfied but easily tempted by your competition, and Detractors (answered 0-6): unhappy customers, high likelihood for negative word of mouth, high churn rate. “
From streamlining interactions and increasing service speed to reducing escalations and empowering customers, you’ll get the inside track on why the combination of Computer Vision AI and Augmented Reality is at the heart of Customer Experience strategy for global brands like Vodafone Group and Nespresso. It must be clear and simple.
“A 2014 survey suggested that 69% of customers feel that their call center experience improves when the customer service agent doesn’t sound as though they are reading from a script. Implement IVR post-call surveys to glean better insights from callers. Encourage agents to cheer up callers with more flexible scripting.
In our webinar, 2022 SaaS retention benchmarks , SaaS Capital Manager Director Rob Belcher shares the results from their 11th annual B2B SaaS benchmarkingsurvey. It’s the largest survey of private SaaS companies in the world with over 1,500 responses. It’s a judgment call is the bottom line.
Responses are scored on a scale from 0 to 10, with answers grouped into three categories: Promoters (9-10), Passives (7-8), and Detractors (0-6). Some companies, like those highlighted in Qualtrics’ NPS Guide , use NPS not only for insights but also for benchmarking. The beauty of CSAT is its adaptability.
This results in survey fatigue, lowered response rates , and aggravated customers who begin to select low scores because they feel overtaxed. Surveying at the wrong time. Customers need to have been using the product for long enough to form an opinion before answering the NPS survey. Sending NPS to the same people too often.
The customer service department of more than half of this group (27% of the respondents) is only available during the daytime Monday to Friday. 43% of the ecommerce shops visited during this survey, offer chat as a contact channel on their website. Based on this survey, what should they focus on? ” Chatbot: live or hybrid?
In this episode of the Agile Brand podcast with Greg Kihlström, Martha Brooke discusses the science of CX surveys. Martha touches on why most customer experience programs aren’t scientific, how you can become more scientific in your approach, and when and how to use AI in your survey program. Customers have priorities.
We organize all of the trending information in your field so you don't have to. Join 34,000+ users and stay up to date on the latest articles your peers are reading.
You know about us, now we want to get to know you!
Let's personalize your content
Let's get even more personalized
We recognize your account from another site in our network, please click 'Send Email' below to continue with verifying your account and setting a password.


Let's personalize your content