This site uses cookies to improve your experience. To help us insure we adhere to various privacy regulations, please select your country/region of residence. If you do not select a country, we will assume you are from the United States. Select your Cookie Settings or view our Privacy Policy and Terms of Use.
Cookie Settings
Cookies and similar technologies are used on this website for proper function of the website, for tracking performance analytics and for marketing purposes. We and some of our third-party providers may use cookie data for various purposes. Please review the cookie settings below and choose your preference.
Used for the proper function of the website
Used for monitoring website traffic and interactions
Cookie Settings
Cookies and similar technologies are used on this website for proper function of the website, for tracking performance analytics and for marketing purposes. We and some of our third-party providers may use cookie data for various purposes. Please review the cookie settings below and choose your preference.
Strictly Necessary: Used for the proper function of the website
Performance/Analytics: Used for monitoring website traffic and interactions
You’ve probably heard the terms ASA and servicelevel. What is ServiceLevel? Servicelevel is a standard way contact centers measure performance and efficiency. It’s displayed as two numbers — the first indicating the percentage of calls answered, and the second indicating the target time period in seconds.
Servicelevel is one of the most common metrics employed at call and contact centers to define how the center is performing. Senior management becomes acclimatized to looking for that servicelevel number and reacting to it as a gauge of how well they’re performing against targets and in meeting their customer needs.
From essentials like average handle time to broader metrics such as call center servicelevels , there are dozens of metrics that call center leaders and QA teams must stay on top of, and they all provide visibility into some aspect of performance. But if there is a single sore point: it’s the often-ridiculous waittimes.
And of course, use the right combination of help desk tips and tricks. Help desk software can efficiently track the right metrics for your business, including new tickets, ticket volumes, ticket distribution, response and waittime, resolution time, backlogs, satisfaction rates, etc. Own the Customer’s Case.
First Response Time (FRT) : FRT tracks the time it takes for an agent to provide an initial response to a customer inquiry. This is critical for setting the tone of the interaction and minimizing customer waittimes. ServiceLevel: This metric measures the percentage of calls answered within a specified timeframe.
This metric deals with success rates in customer acquisition over the course of a single call, before follow-ups are made. Consider the time customers spend on hold carefully. “Even before customers engage with an agent, customers judge your company based on how long they remain on hold — and how you communicate waittimes.
Decision engines use data and analytics to identify the best course of action in a situation. This can help businesses take the guesswork out of customer service and ensure that every interaction is handled in the most efficient way possible. Based on this analysis, the decision engine will decide the best course of action to take.
We have seen more than 20 months of long waittimes due to “higher than normal contact volumes”. . They will rationalize and rebalance their staffing and servicelevels for all contact channels. More candidates were ghosting, and current workers reconsidered what they want to do and be when they “grow-up”.
This will improve campaign performance overall including agents’ servicelevels. Reduced Queue waittime : This can be done by having a strong dialer that can reroute calls to different agent groups. Of course, paramount to the efficiency of a contact center is…”. Information accessibility.
So with ‘tongue planted firmly in cheek’, I present a customer translation for commonly used Call Center metrics; SL – Call Center operators know this as ServiceLevel ; the percentage of calls that are answered within a defined period of time. Of course most centers strive to resolve the inquiry to the customer’s satisfaction.
Servicelevel. Servicelevel is a fundamental metric. Your servicelevel tells you how accessible your contact center is to your customers.It’s a metric that helps you evaluate customer demand and staff appropriately for their needs, and it’s a great place to start when you look at KPIs. Agent turnover rate.
With the increasing number of customer touchpoints – email, ecommerce sites, self-service channels, social media, and of course physical locations and phone-based service – companies have more opportunities than ever to interact with their customers. Inconsistent experiences do serious damage.
They also expect businesses to continue treating them as valued customers, and do a better job of communicating changes to normal servicelevels. Margie: "I think I’m getting a bit tired of hearing from businesses, 'Well due to COVID our waittimes will be longer.' 'Due How long is this a viable excuse for service issues?"
Together this makes for an effective quality program, without expensive and time-consuming calibration and ambiguous results. Of course, a process is required to operationalize this approach to ensure that the ‘compliance’ calls are assessed once we have received the customer feedback, managing blackout lists etc. And why would they?
For many years, contact centers have used the Erlang staffing calculator to forecast how many agents they require to meet agreed servicelevels. Erlang C is predominantly used for queuing calculations based on call volumes and the number of agents necessary to achieve certain servicelevels. Do more with less.
Customers are experiencing long hold times High call abandonment rates usually mean customers are experiencing long waittimes in your call center’s queue. By investing time and effort in calls that are ultimately not completed, the call center incurs unnecessary operational costs.
The issue could be as simple as getting general information (such as an address or hours of operation) or as complex as such as setting up a detailed account for high value services (i.e. obtaining a mortgage or an insurance policy) and of course anything in between. however, numbers closer to 1.0 FCR Ceiling (Upper Limit).
Really, it’s a promise, one you must keep in order to satisfy clients and maintain the servicelevels that will keep your long-lasting relationship with them buoyed. Anyone working in the service industry, be it in retail, health or finance, should get the low-down on ServiceLevel Agreements (SLAs), and fast.
A business analyst can measure things like waittimes, behind-the-scenes troubleshooting and problem resolution rates and adjust call center strategy accordingly. Of course, ongoing staff training, feedback from staff and ensuring they are inspired within the call center is vital to performance. Allan Borch. allan_borch.
Ensures a seamless customer experience by connecting users to the right person quickly, reducing waittimes and minimizing frustration. Imagine the following scenario: A student at a university needs help registering for a course. Customer service automation enables organizations to scale instantly without increasing headcount.
A study from the MIT Sloan Review found that customer service expectations had two levels: desired (what the customer hopes to obtain) and sufficient (what the customer would find acceptable). Of course, there’s a third level: unsatisfactory, where companies miss the mark entirely.
However, if you want to: improve the cost-effectiveness of your call center raise your servicelevels effectively improve CSAT and provide better customer experiences understand staffing needs to manage demand and call volume improve employee retention and satisfaction …then you need workforce management.
Call Center Customer Service Tips for a First-Class Experience. Whichever industry your business is in, your customer servicelevels matter—a lot. Businesses that offer top-notch customer service and support enjoy better brand awareness and reputation, capture more leads, retain more customers and have overall happier clients.
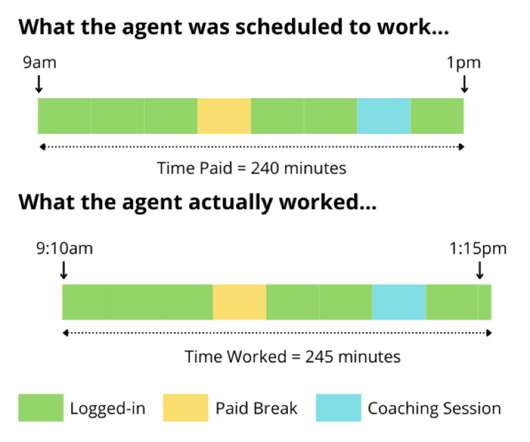
If not, servicelevels will falter, waittimes will increase, and agents will have a higher workload when they are working. Of course, in the scenario above, the agent takes a paid break. An agent starting their shift ten minutes late will hurt servicelevels, occupancy rates, and queue time.
Service and support reps are often inundated with calls, resulting in longer waittimes for customers and prospects calling in. Of course, saved time also means that agents are able to deliver better service and that agents are getting more efficient in their work. Current state of call centers.
If you’re not making metrics and real-time data clear and digestible for your team, you’re putting your customer service experience at risk. To help, we’re sharing three example dashboards you can use with agents and team leads to fuel better servicelevels. Customer Satisfaction Dashboard.
However, not all customer service solutions are created equal. Today’s clients are no longer willing to put up with long waittimes or a company that only offers one channel to get in touch through. Response time also adheres to set targets and refers to the time it takes agents to complete or handle all customer inquiries.
No matter what kind of restaurant it is, excellent customer service is crucial to keeping it prosperous. While there are many quantitative metrics to measure, such as how long it takes to cook a dish or the average customer waittime, identifying those intangible qualities of customer service can be a little trickier.
Tracking key performance indicators (or KPIs) is important for managing the performance of your customer service team. An outsourcer should be tracking metrics such as first reply time, full resolution time, customer satisfaction, customer satisfaction, and average waittime.
If you currently use inbound or outbound call center services and are looking for ways to: expand your services improve servicelevels increase efficiency develop more flexible and scalable models support business growth …then a blended call center might be a better fit for your business.
A study from the MIT Sloan Review found that that customer service expectations had two levels: desired (what the customer hopes to obtain) and sufficient (what the customer would find acceptable). Of course, there’s a third level: unsatisfactory, where companies miss the mark entirely.
Over the course of the webinar, Nate shared some of the wisdom he has learned as SpotHero’s Support Operations Lead and offered valuable advice to listeners during a lively Q&A session. Like many call centers, SpotHero measures and tracks common call center metrics such as servicelevel, average waittime and average handle time.
Of course, growth spurts often go hand-in-hand with growing pains. Higher call volumes leading to longer waittimes for your customers and higher stress for your agents? Maybe it’s time to consider the benefits of outsourcing some or all of that customer care volume.
Twitter: @bradcleveland Explain the “why” behind schedule adherence, the importance of being “in the right place at the right times.” The relationship between staff and servicelevel is not linear – it’s exponential. You'll need either a LinkedIn Premium subscription or a Lynda account to view the full course.
In their survey, they gauged satisfaction with process and speed-related components (like the length of time from initial post to company reply or the waittime between responses), and they also gauged outcome components (like assessing whether the remedy that was provided addressed the issue that they contacted about).
In their survey, they gauged satisfaction with process and speed-related components (like the length of time from initial post to company reply or the waittime between responses), and they also gauged outcome components (like assessing whether the remedy that was provided addressed the issue that they contacted about).
Customers call, agents resolve their queries, managers supervise, all things seem to run their course… STOP! Outbound and inbound customer services should be constantly measured to be improved. Average WaitingTime. Average handling time. ServiceLevel. Average WaitingTime.
When scheduling is done right, you’ll be able to improve first-call resolution, maximize cost efficiency, and boost overall customer satisfaction and servicelevel scores. Here’s the thing: customers in this day and age care more about great customer service experiences than ever. How productive are they?
In an omnichannel contact center, its crucial to allocate more agents to channels that anticipate higher activity levels, such as chat during peak sales events or phone support after a product release. Heres the thing: customers in this day and age care more about great customer service experiences than ever.
In this post: Average Handling Time Customer Satisfaction ServiceLevel First Contact Resolution Call Abandonment Rate Percentage of Calls Blocked Call Transfer Rate Wrap-up Time Customer Effort Score Average Idle Time. Of course, this feedback is only useful if you can do something about it!
Decide which among the numerous customer service metrics are going to be the apt indicators of impressive customer service and brings customer satisfaction. Your team will definitely grow in due course, and then what you will urgently look for is consistent assessment and management. Average Response Time.
Whether it is for a special holiday, or for a time of year, many businesses experience volume fluctuations in their customer care needs. There are many considerations and departments involved in ensuring your customers continue to receive the servicelevels they expect. Staffing for these fluctuations is a difficult task.
Basically, this isn’t their first rodeo anymore and each new franchise opens with only a minimum of hiccups… again, even those are most likely known to happen over the course of opening so many locations. This caused me to be waiting in line while the rest of my family enjoyed the food they found right away.
These reports are the snapshots, the tangible records that document everything from call volumes and servicelevels to agent productivity and customer satisfaction scores. Call Center Analytics : If reporting is the compass, then analytics is the sextant, enabling navigators to chart a course towards future destinations.
We organize all of the trending information in your field so you don't have to. Join 34,000+ users and stay up to date on the latest articles your peers are reading.
You know about us, now we want to get to know you!
Let's personalize your content
Let's get even more personalized
We recognize your account from another site in our network, please click 'Send Email' below to continue with verifying your account and setting a password.


Let's personalize your content