This site uses cookies to improve your experience. To help us insure we adhere to various privacy regulations, please select your country/region of residence. If you do not select a country, we will assume you are from the United States. Select your Cookie Settings or view our Privacy Policy and Terms of Use.
Cookie Settings
Cookies and similar technologies are used on this website for proper function of the website, for tracking performance analytics and for marketing purposes. We and some of our third-party providers may use cookie data for various purposes. Please review the cookie settings below and choose your preference.
Used for the proper function of the website
Used for monitoring website traffic and interactions
Cookie Settings
Cookies and similar technologies are used on this website for proper function of the website, for tracking performance analytics and for marketing purposes. We and some of our third-party providers may use cookie data for various purposes. Please review the cookie settings below and choose your preference.
Strictly Necessary: Used for the proper function of the website
Performance/Analytics: Used for monitoring website traffic and interactions
New data from The Northridge Group provides a clear message to businesses. According to The Northridge Group's State of Customer Service Experience 2020 report, as a result of COVID-19, 68% of consumers have increased their online shopping and plan to continue at this increased rate post-pandemic.
CustomerEffort Score (CES) measures how hard it is for your customers to get help from your customer service teams. And if youve ever had a hard time canceling a subscription or fixing a billing issue, you know exactly why it matters. Thats where CustomerEffort Score (CES) comes in.
CustomerEffort Score seeks to quantify and highlight these very difficult conversations, so that customer service teams can avoid them in the future. Created in 2010, the CustomerEffort Score is fairly new to the scene but is becoming increasingly more popular. What is CustomerEffort Score (CES)?
Higher average waittime (AWT) almost always leads to higher abandonment rates and lower CSAT scores. No one likes to wait more than a few minutes to connect with a support agent (unless there’s a grave issue that’s worth the wait). Let’s see how you can solve these challenges and reduce waittimes.
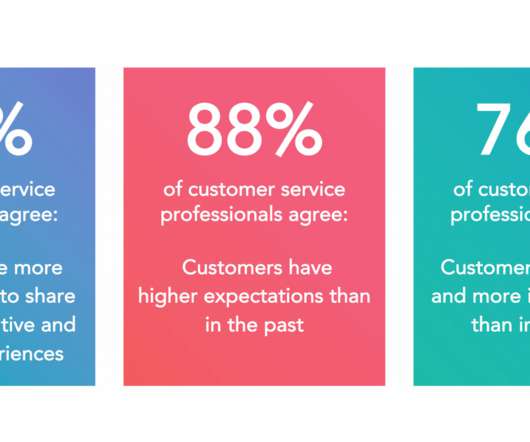
I was recently asked by The Northridge Group to review their 2019 State of Customer Service Experience report. 68% of consumers experience a long waittime to reach an agent while 64% say they experience difficulty when trying to navigate a company’s website. 86% of consumers will tell others about a bad service experience.
Call Abandonment Rate Definition: The percentage of calls disconnected by customers before reaching an agent. Why It Matters: High abandonment rates suggest long waittimes or poor IVR (Interactive Voice Response) design, leading to customer frustration.
In this article, well explore what contact center analytics are and cover some of the best practices for using contact center analytics to improve business performance and strengthen customer relationships. Benefits for business: Tracking analytics can increase customer satisfaction, employee performance, and business efficiency.
CustomerEffort Score (CES): CES measures the level of effort a customer perceives they had to exert to resolve their issue. This metric helps identify friction points in the customer journey and highlights areas where agents can streamline processes.
Automation and AI, intended to enhance efficiency, often result in impersonal interactions, leaving customers disconnected. Staffing shortages and supply chain disruptions further exacerbate these challenges, leading to longer waittimes and reduced service quality.
Situations are often complex, customer stress runs high, regulatory requirements are stringent, and operational margins are tight. Lets take a look at common insurance customer service challenges in depth and how your company can build a better customer experience with a state-of-the-art IVA.
And, another 76% think customers are smarter and more informed, too. Now more than ever, you have to strategize what it takes to fuel your customer happiness. To help, we’re sharing 6 data-backed methods on how to keep customers happy. Reduce your waittimes. If you don’t, you put future business at risk.
Additionally, the company’s routing solution can improve the customer experience, sales conversion and reduce talk time. Mattersight has found that using call data and analytics to pair customers with agents best equipped to handle their unique personality style leads to significant and measurably improved call outcomes.
This creates a more efficient workflow and reduces customerwaittimes. This reduces waittimes and improves first-call resolution rates. Predictive analytics identify peak call times and staffing needs, enabling managers to optimize schedules and resources. Increased efficiency is another major benefit.
Studies have shown that customers are willing to wait a little longer than expected – but anything beyond that and they can become extremely dissatisfied. Similarly, call center agents are measured on their average handle times. Personalized customer interactions are another area where AI excels.
Share data and results of the customer experience analytics in an easy-to-use tool. A handful of inspiring articles on customer centricity: How to empower your organization to improve customer experience by Lumoa, “ 7 Secrets Of Building A Customer-Centric Company Culture ” by Micah Solomon.
Managing Customers: While much of call center management deals directly with the organizations operations, these activities ultimately tie back to one thing: the customer experience, or CX. The ability to deliver personalized and seamless customer experiences is paramount. But first, you have to capture that activity.
That means operational metrics like Average Speed of Answer (ASA), Average Handle Time (AHT), and FCR prove to focus on controlling costs instead of ensuring overall customer satisfaction. Plus, you can draw a clear line of distinction between a shorter AHT and reduced customerwaittimes.
Because call centers are at the front lines of customer interaction, they’re a goldmine for customerdata. You can find out a customer’s age, gender, nationality, and other similar information through your call centers. Modern-day customers interact with your business through an average of nine different channels.
SuperOffice says that 86% of buyers are willing to pay more for a great customer experience A good customer experience management tool should make it easy to track and report on how your customers feel about your business, take the data you gather from customers, analyze it, and then distill it into an easy-to-digest report or dashboard.
Number of chats Agent utilization rate Average waittime Average chat time First contact resolution Invitation acceptance rate Sales conversion rates Visitor logs and wrap-up notes Customer satisfaction scores. Average waittime. to save time. Read more: Live Chat Metrics 2022 – Benchmark Data.
Today, contact centers are increasingly viewed by businesses as the key to understanding customers. They’re valued by c-suites for providing insights gleaned from direct contact via customer service and support channels. Managers take note: this means that the phone channel remains an essential part of offering great customer service!
These metrics, which we retrieve through our post-chat surveys , allow us to gauge our customers’ individual experiences with our team. And by diving into this customerdata , we’re able to significantly improve our overall brand customer experience. Live chat metric #4: customereffort score (CES).
We live in a data-driven world and businesses who thrive are the ones who can leverage this data effectively. This specifically applies to contact centers which are in the frontline of customer service and are gathering heaps of information, insights and data every minute, every hour, every day.
To develop a customer experience scorecard means to put together customerdata in a useful format that will help you compare your business’ goals and expectations and your actual customer journey. Once contrasted, you can try to figure out the ways of improving the customer journey so that it meets your expectations.
Just like with any relationship, direct, clear, and timely communication is the key to maintaining (and even improving) your relationship with customers. Evaluate short-term customer journeys during the crisis with the goal of lowering customereffort and guiding them toward the most relevant information. .
The customer calls it “shopping elsewhere.”. You call it processing time. The customer sees it as waittime. Sharing the same vocabulary with your #customer puts you on the path to a more customer-centric culture. It focuses on customer needs, expectations, understandings, and product improvement.
Customer churn. Call waittime. — — — — — — — — — — — —. This metric looks at the total number of times your customers interact with your support team across any channel that you support. . — — — — — — — — — — — —. Call waittime. What is call waittime? Customereffort score (CES).
To improve agent experience, utilities should focus on implementing automation that ca n take over data-driven, complex, transactional conversations, so human agents can focus on tasks that need their expertise and special training. Offer self-service options to decrease waittimes. Proactive and direct communication.
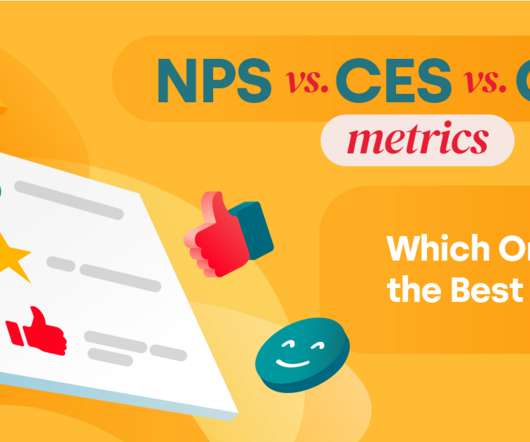
At Outsource Consultants, we have identified four key metrics that provide a comprehensive assessment of customer experience: Net Promoter Score (NPS) , Customer Satisfaction Score (CSAT) , CustomerEffort Score (CES) , and First Contact Resolution (FCR). Offer callback options to reduce customerwaittimes.
You will empower your team to truly work as a cohesive unit, and this will make a favorable impression on your customers. The latter will also notice that your call funnel ris more efficient, with shorter waitingtimes and fewer dropped or missed calls. Data monitoring. Survey customer satisfaction through user habits.
What this actually looks like will vary by company, but the goal of CXM is always to increase customer satisfaction, loyalty, and brand advocacy while cutting costs. What are the customer experience maturity levels? And your programs and processes should reinforce customer connectedness.
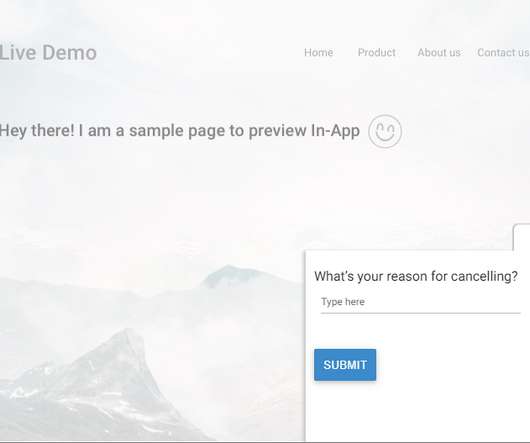
This is one of the most direct ways to collect customerdata and doesn’t rely on emails for collecting responses. The in-app surveys allow convenient and relevant data collection and offer you direct and swift insights into customer behavior. . CustomerEffort Score (CES). Social Media Monitoring.
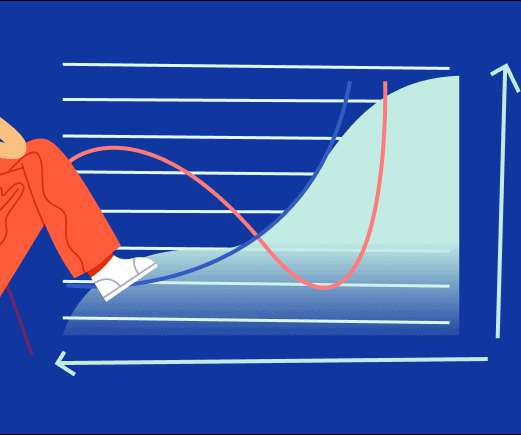
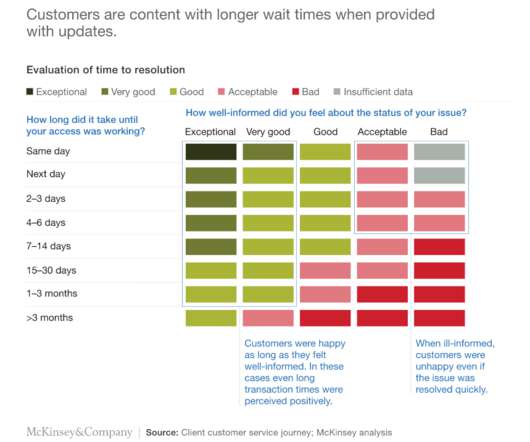
The challenge, however, is that the more complex the customer journey, with more channels and points of contact in a single customer journey, the more effort (read: expense) is required from an organization to resolve each interaction – and often, as shown in the graph above, more customereffort is required to reach resolution.
Prior to this, we had all read the book, “ The Effortless Experience: Conquering the New Battleground for Customer Loyalty ,” and one question came out of it: Is effortless really enough? . While some data says yes, other research says no. . 3: Customer service interactions drive more disloyalty than loyalty, in general.
Correspondingly, making the customer jump through hoops just to find your phone number will make them that much more irate when they do call you up. You could go the extra-mile and further minimize customers’ effort by providing a click-to-call button. Customer service mistakes: You’re disregarding the data.
In other contact centers the data is stale by the time it is received, making it essentially ineffective for helping the manager control their own destiny and performance. This approach gives managers the data they need to take corrective action on a timely basis. KPIs for Managing your Contact Center. Happy New Year!
Reduce Employee Effort. Agent experience is directly correlated with customer experience. Therefore, reducing employee effort reduces customereffort, which equals greater customer satisfaction. This results in faster, more direct, and productive conversations between agents and customers. .
As customers reply, you can keep track of your average score and segment responses by specific criteria (like customer type, region, agent, etc.) CustomerEffort Score (CES). Offering quick and effective support is the surest way to make your customers happy. Customers get frustrated with continual back-and-forths.
It is a direct reflection of an agent’s and a center’s capacity to solve problems, answer questions, and provide needs the very first time a customer calls. Simply put, it’s getting it right the first time and reducing customereffort. It’s also best to set expectations and be transparent with the waittime.
You can use the CSAT method to ask specific questions or allow customers to elaborate on their answers to help you identify root causes. CustomerEffort Score (CES). CustomerEffort Score indicates how easy your customers consider interacting with your customer service team.
Call center monitoring is the continuous process of data collection, analysis, and feedback. First, you gather data pertaining to your call centre’s performance (employee efficiency, customer attrition, speediness of execution, etc.), No one enjoys waiting on hold, and high call abandonment is a symptom of that.
Tracking the following KPI metrics can help your contact center identify areas of strength as well as areas of the customer experience that could use improvement. Customer Satisfaction (CSAT) Customer satisfaction (CSAT) is one of the most important call center KPIs to monitor.
To ensure customer experience doesn’t suffer, track contact center key performance indicators (KPIs) that provide a complete picture that maps back to your business goals. However, if calls are shorter because they’re getting transferred, first contact resolution drops and customers’ frustrations start to rise. Integrate Data Sources.
This data is usually gathered by survey – which can be sent by email, pushed to the end user of an app, or triggered at the end of a customer service interaction. For a general percentage measure of customer satisfaction, divide the sum of all individual scores by the maximum possible total score, and multiply by 100.
We organize all of the trending information in your field so you don't have to. Join 34,000+ users and stay up to date on the latest articles your peers are reading.
You know about us, now we want to get to know you!
Let's personalize your content
Let's get even more personalized
We recognize your account from another site in our network, please click 'Send Email' below to continue with verifying your account and setting a password.


Let's personalize your content